Java 23, SpringBoot 3.3.4: Tracing: OpenTelemetry — Part 7
In the previous sessions, we explored Logs, Events, and Metrics as key components of observability. Today, we’ll shift our attention to Tracing, completing the observability triad of Logs, Metrics, and Traces.
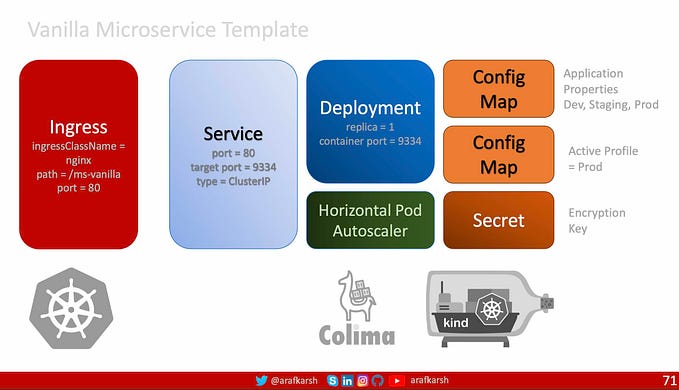
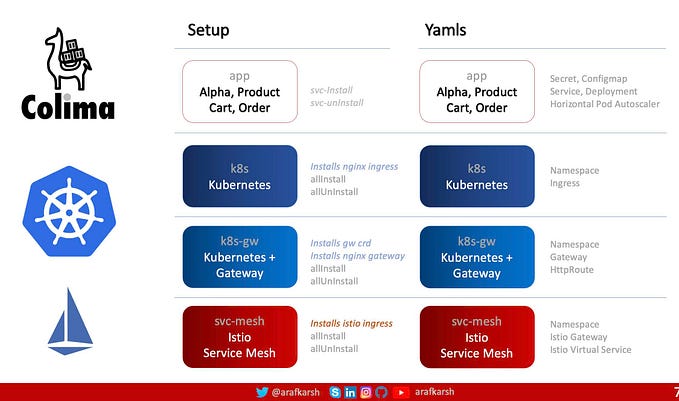
This session will delve into how OpenTelemetry, a Cloud Native Computing Foundation (CNCF) project, integrates with Micrometer in a Spring Boot application. Additionally, we’ll examine how these tools/libraries function cohesively in a Kubernetes-based deployment model.
Before we dive into the integration process, we’ll briefly recap the concepts covered so far in the Java 23 and Spring Boot 3.3.4 series.
- Part 1: Hexagonal Architecture implementation, along with API documentation using Swagger and OpenAPI.
- Part 2: Spring AOP (Aspect-Oriented Programming) for streamlined exception handling, standard HTTP responses, and comprehensive bean validation.
- Part 3: Logback Configuration using both file-based and console appenders for effective logging.
- Part 4: Log/Events: Development of RESTful Endpoints & understanding the API flow and AOP-driven logging for enhanced traceability.
- Part 5: Metrics — Micrometer, Prometheus, and Actuator. In this section, we explored how these APIs integrate seamlessly into a Spring Boot application and examined the standout features of Micrometer, highlighting its capabilities and role in effective metrics management.
- Part 6: Metrics: Micrometer & AOP — Integrating Metrics using Micrometer with Spring Boot AOP.
- Part 7: Tracing: OpenTelemetry: This section will spotlight the integration of OpenTelemetry with Micrometer, exploring their combined capabilities and use cases.

Tracing
Tracing is a key observability practice that helps track and record the flow of requests through a system, especially in distributed or microservice-based architectures.
It captures the path of a request as it travels across multiple services, highlighting each service’s contribution to the overall operation and providing visibility into latency, errors, and performance bottlenecks.
Key Components of Tracing:
- Trace: Represents the entire journey of a request across a system. A trace is made up of one or more spans.
- Span: Represents a single unit of work within a trace (e.g., processing in one microservice). Each span contains:
- Start and end timestamps. (Not in Trace Propagation)
- Metadata such as operation name, service name, and tags.
- Relationships to other spans (e.g., parent-child relationships).
3. Context Propagation: Passes trace context (trace ID, span ID) across service boundaries so the system can connect spans to form a trace.
Why is Tracing Important in Microservice/Cloud-Native Architectures?
Microservices and cloud-native architectures consist of small, independently deployable services that work together to handle user requests. While these architectures provide scalability and flexibility, they also introduce complexity. Tracing is critical in such environments for the following reasons:
1. Debugging and Root Cause Analysis
- Challenge: Distributed systems can have complex dependencies and failure points. Identifying the root cause of an issue is difficult without end-to-end visibility.
- How Tracing Helps: Tracing provides a complete view of how a request flows through the system, pinpointing where errors or latency occur.
- Example: If a user experiences a timeout, tracing can reveal if a slow database query, a misbehaving service, or a network issue caused it.
2. Performance Optimization
- Challenge: Microservices can introduce latency as requests hop between services over the network.
- How Tracing Helps: Tracing breaks down the time spent in each service or operation, identifying bottlenecks.
- Example: A trace might show that 80% of the request’s latency comes from a single downstream API call, guiding optimization efforts.
3. Dependency Mapping
- Challenge: Modern applications often involve dozens (or hundreds) of microservices with dynamic dependencies.
- How Tracing Helps: Tracing tools visualize the dependencies between services, making it easier to understand and maintain the architecture.
- Example: Tracing reveals that Service A depends on Service B and Service C, allowing teams to anticipate the impact of changes.
4. Proactive Monitoring
- Challenge: Issues such as increased latency, errors, or degraded performance can spread across services before being detected.
- How Tracing Helps: Tracing works in real-time, enabling proactive monitoring. Traces can trigger alerts based on anomalies like high error rates or unexpected delays.
- Example: If Service D suddenly starts taking 3x longer to respond, tracing can highlight this as an anomaly and notify the relevant team.
5. Improving User Experience
- Challenge: Latency or failures in one part of the system can degrade the end-user experience.
- How Tracing Helps: Tracing connects user-facing issues with backend behaviour, helping teams prioritize fixes that improve user satisfaction.
- Example: If users are experiencing slow page loads, tracing can reveal which backend service is causing delays.
6. Cost Management and Scaling
- Challenge: Inefficiencies in the system can lead to unnecessary resource usage and higher cloud costs.
- How Tracing Helps: Tracing highlights inefficient calls, retries, or bottlenecks, enabling better resource allocation.
- Example: A trace might show redundant API calls between services, suggesting an opportunity for optimization.
Tracing Standards and Tools
Standards:
- OpenTelemetry: A vendor-neutral framework for collecting, processing, and exporting telemetry data (traces, metrics, logs).
- W3C Trace Context: A standard for propagating trace context across services.
- B3 Headers: A legacy standard Promoted by Zipkin (Twitter).
Tools:
- Jaeger: Distributed tracing backend for monitoring and troubleshooting microservices.
- Zipkin: Open-source tracing system for managing trace data.
- Splunk APM: Provides advanced analytics for traces.
- Elastic APM: Integrates tracing with the ELK stack.
- Datadog APM: Combines tracing, metrics, and logs for observability.
Comparing B3 Headers and W3C Trace Context
B3 Headers and W3C Trace Context are both mechanisms for context propagation in distributed tracing systems, ensuring trace continuity across service boundaries. While B3 Headers were widely adopted early on, W3C Trace Context has emerged as a modern, standardized approach supported by many observability tools.

How Tracing Works in Microservices
The diagram illustrates the concept of distributed tracing across a service architecture, where a unique Trace ID (abcdef1234567890abcdef1234567890) is generated by Service A to represent the entire request lifecycle. As the request propagates downstream, each service (B, C, and D) reuses the same Trace ID to ensure end-to-end traceability.

Additionally, each service generates its own Span ID (e.g., 1111111111111111 for Service A, 2222222222222222 for Service B) to represent its individual operation within the trace.
This mechanism allows for tracking the relationships between services, where the Parent-Child hierarchy of spans reveals how requests flow through the system, facilitating performance monitoring and debugging.
The table below illustrates how headers are generated by each receiving service. For example, Service A creates headers (Row 1), and in the B3 model, the Parent Span ID is set to none, then Service B (Row 2), Service C (Row 3) and Service D (Row 4).
- B3 Headers: These use multiple headers to explicitly propagate trace and span context, including the Parent Span-ID.
- W3C Trace Context: Adopts a compact format using the traceparent header, while parent-child relationships are managed internally through tools like OpenTelemetry.

W3C Traceparent Header
- Traceparent: A single header that propagates the trace context, formatted as:
traceparent: <version>-<trace-id>-<span-id>-<trace-flags>- <version>: Always 00 (current W3C Trace Context version).
- <trace-id>: A 16-byte (32-character) unique identifier for the trace.
- <span-id>: An 8-byte (16-character) unique identifier for the current span.
- <trace-flags>: Sampling flag (01 for sampled, 00 for not sampled).
2. Tracestate (Optional): Vendor-specific metadata for additional context.
Why W3C Does Not Include Parent Span in Header
W3C Trace Context focuses on:
- Minimizing Header Size: Reducing the number of fields in the traceparent header ensures efficiency, especially for large-scale distributed systems.
- Flexibility: The Parent Span ID is a backend-specific concern. Backend systems like Jaeger, Zipkin, or OpenTelemetry already store and handle parent-child relationships in their internal data structures.
1. Generating Traces
- Each incoming request is assigned a unique trace ID.
- Each operation (e.g., processing a request in a service) generates a span, linked to the trace ID.
2. Propagating Context
- Trace context (trace ID, parent span ID) is passed between services using standard headers like:
- W3C Trace Context: traceparent, tracestate.
- B3 Headers: X-B3-TraceId, X-B3-SpanId by ZipKin (Twitter)
3. Instrumentation
- Services are instrumented using libraries like OpenTelemetry, Brave, or Jaeger to generate and propagate traces.
4. Storing and Analyzing Traces
- Traces are sent to a backend system for storage and analysis (e.g., OpenTelemetry, Jaeger, Zipkin, Splunk, ELK, Datadog, & New Relic).
5. Visualizing Traces
- Tracing tools provide visualizations, showing the flow of requests through services and highlighting key metrics like latency and error rates.
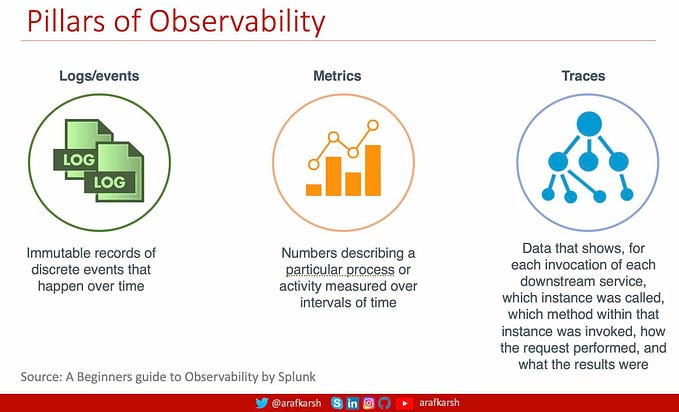
Summary: Tracing as an Observability Pillar
Tracing is one of the three pillars of observability (along with metrics and logs). Its importance in microservice and cloud-native architectures cannot be overstated, as it provides the visibility required to:
- Debug complex issues.
- Optimize performance.
- Understand dependencies.
- Improve the user experience.
By implementing tracing, teams can ensure that their systems remain maintainable, scalable, and resilient, even as they grow in complexity.
Logs / Metrics / Tracing — Tools Comparison
Below is a list of leading tools in the industry for handling observability data (logs, metrics, and traces), along with a comparison of their server and storage capabilities, as well as their support for the three fundamental observability pillars (logs, metrics, and traces).

Comparison summary
The table below presents a comparison of widely-used tools in the observability domain, focusing on their roles in managing logs, metrics, and traces. These tools are grouped by their primary functionality, such as unified observability, logging, metrics collection, or tracing.
Their key strengths are highlighted, showcasing how they excel in modern cloud-native ecosystems. In this series, we will specifically explore OpenTelemetry, a prominent initiative supported by the Cloud Native Computing Foundation (CNCF).

OpenTelemetry
OpenTelemetry (OTel) is a vendor-neutral observability framework for cloud-native software. It provides tools, APIs, and SDKs for collecting, processing, and exporting telemetry data (traces, metrics, and logs) to observability platforms.
OpenTelemetry satisfies the need for observability while following two key principles:
- You own the data that you generate. There’s no vendor lock-in.
- You only have to learn a single set of APIs and conventions.
Both principles combined grant teams and organizations the flexibility they need in today’s modern computing world. Source: Open Telemetry: What is Open Telemetry?

Key Features
- Instrumentation for Tracing, Metrics, and Logs: Automatically or manually instrument applications to collect data on application performance, resource usage, and dependencies.
- Cross-Language Support: Offers SDKs for various programming languages like Java, Python, Go, .NET, and more.
- Open Standards: Based on open standards like W3C Trace Context for distributed tracing.
- Extensibility: Supports custom instrumentation and extension points for specific use cases.
- Integration with Observability Tools: Integrates with popular observability platforms like Prometheus, Jaeger, Zipkin, Grafana, Splunk, Datadog, and others.
- Context Propagation: Automatically propagates context across distributed systems using standards like W3C Trace Context.
- Aggregation and Export Pipelines: Provides mechanisms to collect data, process it, and export it to backend systems in a structured manner.
- Auto-Instrumentation: Pre-built agents for auto-instrumenting libraries and frameworks, reducing manual effort.
- Sampling and Rate Limiting: Offers configurations for controlling data volume through sampling strategies.
- Evolving Ecosystem: Continuous improvements through a vibrant open-source community, governed by the Cloud Native Computing Foundation (CNCF).
Tracing and the Role of OpenTelemetry
Tracing is a critical pillar of observability that enables the tracking of requests as they flow through distributed systems, such as microservices architectures. By recording trace data with unique Trace IDs and Span IDs, tracing helps identify performance bottlenecks, debug errors, and visualize the parent-child relationships between services in a request lifecycle.
OpenTelemetry plays a central role as a vendor-neutral, open-source framework for generating, collecting, and exporting telemetry data (traces, metrics, and logs). It unifies observability efforts by:
- Standardizing context propagation through protocols like B3 Headers and W3C Trace Context.
- Providing SDKs and APIs for automatic and manual instrumentation across various programming languages.
- Supporting flexible backends, such as Jaeger, Zipkin, Prometheus, or Elastic APM, for storing and analyzing trace data.
By ensuring interoperability and reducing vendor lock-in, OpenTelemetry empowers organizations to implement consistent tracing across their systems, improve application performance, and enhance troubleshooting in modern cloud-native environments
Having gained a solid understanding of Tracing, its significance in Cloud Native Architecture, and the pivotal role of OpenTelemetry, championed by the CNCF, our next session will take a deeper dive into its application in a Spring Boot environment. We’ll explore the complete setup, implement custom tracing, and demonstrate how traces are propagated seamlessly across services.
Source Code: GitHub Repository: ms-springboot-334-vanilla — Microservice Template with SpringBoot 3.3.4 with Java 23 and Jakarta EE 10. NFRs — AOP, Exception, Logging, Micrometer, Crypto and Security (JWT) Framework.
Enjoy the week with a Cup of Java sprinkled with SpringBoot & AOP…
Java 23, SpringBoot 3.3.4 & Jakarta 10 Series
- Java 23, SpringBoot 3.3.4 & Jakarta 10 — Part 1
- Java 23, SpringBoot 3.3.4: AOP Exception Handling — Part 2
- Java 23, SpringBoot 3.3.4: Logback Setup — Part 3
- Java 23, SpringBoot 3.3.4: Log/Events: API Flow & Logging — Part 4
- Java 23, SpringBoot 3.3.4: Metrics: Micrometer, Prometheus, Actuator — Part 5
- Java 23, SpringBoot 3.3.4: Metrics: Micrometer & AOP — Part 6
- Java 23, SpringBoot 3.3.4: Tracing: OpenTelemetry — Part 7 (This article)
- Java 23, SpringBoot 3.3.4: Tracing: OpenTelemetry In Action — Part 8 Coming Soon
- Java 23, SpringBoot 3.3.4: Filters: Security, Log — Part 9 Coming Soon
- Java 23, SpringBoot 3.3.4: AOP: Spring Security — Part 10 Coming Soon
- Java 23, SpringBoot 3.3.4: CRUD — Part 11 Coming Soon
- Java 23, SpringBoot 3.3.4: CRUD Queries & Page Sort — Part 12 Coming Soon
Further Research
- W3C: November 23, 2021 — Trace Context
- W3C: March 28, 2024 — Trace Context Level 2
- Open Telemetry: What is Open Telemetry?
- Open Telemetry: Open Telemetry Concepts
- Open Telemetry: Documentation
- Micrometer: Implementing Open Telemetry
- Micrometer: Concepts
- Micrometer: Tracing Support
- Micrometer: Supported Tracers — Brave, Open Telemetry
- Micrometer: Tracing API
- Jaeger: Distributed Tracing
- Zipkin: Distributed Tracing
- Splunk: Application Performance Monitoring
- Elastic: Application Performance Monitoring
- Elastic Stack: Elastic Search, Logstash, Kibana & Beats
- Istio: What is Envoy?