Java 23, SpringBoot 3.3.4: Metrics: Micrometer & AOP — Part 6
In this session, we will delve into integrating Metrics using Micrometer with Spring Boot AOP. Our primary focus will be on exploring key aspects of non-functional requirements, with a special emphasis on observability — a crucial component of modern cloud-native applications. Before we dive into the integration process, we’ll briefly recap the concepts covered so far in the Java 23 and Spring Boot 3.3.4 series.
- Part 1: Hexagonal Architecture implementation, along with API documentation using Swagger and OpenAPI.
- Part 2: Spring AOP (Aspect-Oriented Programming) for streamlined exception handling, standard HTTP responses, and comprehensive bean validation.
- Part 3: Logback Configuration using both file-based and console appenders for effective logging.
- Part 4: Log/Events: Development of RESTful Endpoints & understanding the API flow and AOP-driven logging for enhanced traceability.
- Part 5: Metrics — Micrometer, Prometheus, and Actuator. In this section, we explored how these APIs integrate seamlessly into a Spring Boot application and examined the standout features of Micrometer, highlighting its capabilities and role in effective metrics management.
- Part 6: Metrics: Micrometer & AOP — Integrating Metrics using Micrometer with Spring Boot AOP.

Micrometer
Micrometer is a robust metrics instrumentation library tailored for JVM-based applications. It provides a unified API for monitoring and exposing application metrics in a vendor-neutral way. It works seamlessly with various monitoring systems like Prometheus, Grafana, Datadog, New Relic, AWS CloudWatch, Open Telemetry, Azure Monitor and others.
This allows you to instrument your application code without being tied to a specific vendor. Designed for efficiency, Micrometer introduces minimal overhead to your metrics collection process while ensuring maximum portability and flexibility for your monitoring efforts.
It supports dimensional metrics, which allow you to tag metrics with key-value pairs (dimensions) for better filtering, aggregation, and analysis.
With the release of Micrometer 1.10, the library introduces the Observation API and a plugin mechanism, enabling enhanced capabilities such as tracing and other advanced features.
A Meter serves as the interface for gathering a collection of measurements — referred to individually as metrics — about your application. Micrometer provides a suite of Meter primitives, including Timer, Counter, Gauge, DistributionSummary, LongTaskTimer, FunctionCounter, FunctionTimer, and TimeGauge.
Each type of meter generates a different number of time series metrics. For instance, a Gauge represents a single metric, whereas a Timer captures both the count of events and the cumulative duration of those events. In the previous session (Part 5), we explored these various meter types in detail.
MeterRegistry
The MeterRegistry is the central hub in Micrometer for managing and collecting metrics. It acts as the bridge between your application’s metrics and the monitoring systems.
Metrics like counters, gauges, timers, and distribution summaries are registered with the MeterRegistry, which then formats and publishes them to a monitoring backend (e.g., Prometheus, Datadog, etc.).
<dependency>
    <groupId>io.micrometer</groupId>
    <artifactId>micrometer-registry-prometheus</artifactId>
</dependency>
If you’re using other monitoring systems, replace micrometer-registry-prometheus with the appropriate registry e.g.,
- NetFlix: micrometer-registry-atlas
- Microsoft: micrometer-registry-azure-monitor
- Amazon: micrometer-registry-cloudwatch
- DataDog: micrometer-registry-datadog
- Open Source: micrometer-registry-elastic
- NewRelic: micrometer-registry-new-relic
- CNCF: micrometer-registry-otlp
More implementations are available over here…
1. SimpleMeterRegistry:
- A lightweight registry that stores metrics in memory.
- Does not push metrics to any external monitoring system.
public class _13_SimpleMeterRegistry {

    public static void main(String[] args) {
        // Create a SimpleMeterRegistry
        MeterRegistry simpleRegistry = new SimpleMeterRegistry();

        // Create and register a Counter
        Counter counter = simpleRegistry.counter("fusion.air.example.13.SimpleMeterRegistry", "type", "test");

        // Increment the counter
        counter.increment();
        counter.increment();
        counter.increment(3);

        // Print the current value
        System.out.println("Name: "+counter.getId().getName()+" Counter Value: " + counter.count());
    }
}- Output
Name: fusion.air.example.13.SimpleMeterRegistry Counter Value: 5.0- Use Case: Testing and debugging metrics locally without an external monitoring system.
2. CompositeMeterRegistry:
- Combines multiple MeterRegistry instances.
- Useful for applications that need to send metrics to multiple monitoring systems simultaneously.
public class _14_CompositeMeterRegistry {

    public static void main(String[] args) {
        // Create a CompositeMeterRegistry
        CompositeMeterRegistry compositeRegistry = new CompositeMeterRegistry();

        // Add a SimpleMeterRegistry (for local testing)
        SimpleMeterRegistry simpleRegistry = new SimpleMeterRegistry();
        compositeRegistry.add(simpleRegistry);

        // Add a PrometheusMeterRegistry (for Prometheus integration)
        PrometheusMeterRegistry prometheusRegistry = new PrometheusMeterRegistry(PrometheusConfig.DEFAULT);
        compositeRegistry.add(prometheusRegistry);

        // Create and register a Counter
        Counter counter = compositeRegistry.counter("fusion.air.example.14.CompositeMeterRegistry", "type", "test");

        // Increment the counter
        counter.increment();
        counter.increment();
        counter.increment(5);

        // Print the current value from SimpleMeterRegistry
        System.out.println("Name: "+counter.getId().getName()+" Counter Value: " + counter.count());

        // Print the metrics output from PrometheusMeterRegistry
        System.out.println("\nMetrics in Prometheus Format:");
        System.out.println(prometheusRegistry.scrape());
    }
}- Output
Name: fusion.air.example.14.CompositeMeterRegistry Counter Value: 7.0

Metrics in Prometheus Format:
# HELP fusion_air_example_14_CompositeMeterRegistry_total
# TYPE fusion_air_example_14_CompositeMeterRegistry_total counter
fusion_air_example_14_CompositeMeterRegistry_total{type="test"} 7.0
Global Registry
The GlobalRegistry in Micrometer serves as a singleton, default MeterRegistry that aggregates metrics and propagates them to all associated MeterRegistry instances. It provides a centralized mechanism for registering and managing metrics globally across an application.
Key Features of GlobalRegistry
- Singleton Design: GlobalRegistry ensures that all metrics registered via the global context (Metrics.globalRegistry) are forwarded to all MeterRegistry instances added to it.
- Multi-Backend Metrics Propagation: Metrics registered in the GlobalRegistry are automatically sent to every MeterRegistry associated with it (e.g., Prometheus, Datadog, or Graphite).
- Default Fallback: If no explicit MeterRegistry is provided, the GlobalRegistry acts as a fallback to ensure metrics are collected.
- Global Accessibility: Accessible via the Metrics facade (Metrics.globalRegistry), allowing libraries and frameworks to register metrics without requiring a specific MeterRegistry.
public class _15_GlobalRegistryExample {

    public static void main(String[] args) {
        // Access the global registry via the Metrics class
        MeterRegistry globalRegistry = Metrics.globalRegistry;

        // Create and add a SimpleMeterRegistry
        SimpleMeterRegistry simpleRegistry = new SimpleMeterRegistry();
        Metrics.globalRegistry.add(simpleRegistry);  // OR Metrics.addRegistry(simpleRegistry);

        // Create and add a PrometheusMeterRegistry
        PrometheusMeterRegistry prometheusRegistry = new PrometheusMeterRegistry(PrometheusConfig.DEFAULT);
        Metrics.globalRegistry.add(prometheusRegistry);  // OR Metrics.addRegistry(prometheusRegistry);

        // Register a metric with the global registry
        Metrics.counter("fusion.air.example.15.GlobalRegistry", "type", "test").increment();

        // Print the metrics in SimpleMeterRegistry
        System.out.println("Metrics in SimpleMeterRegistry:");
        simpleRegistry.getMeters().forEach(meter -> System.out.println(meter.getId()));

        // Print the metrics in PrometheusMeterRegistry
        System.out.println("\nMetrics in PrometheusMeterRegistry:");
        System.out.println(prometheusRegistry.scrape());

    }
}
How GlobalRegistry Works
- Initialization: GlobalRegistry is initialized as part of Micrometer’s core library. When you call Metrics.globalRegistry, it retrieves the singleton instance of the GlobalRegistry.
- Adding Registries: You can extend the GlobalRegistry by adding specific MeterRegistry implementations (e.g., PrometheusMeterRegistry, DatadogMeterRegistry). Use Metrics.addRegistry() to add additional registries.
- Metric Registration: Metrics registered with the GlobalRegistry are automatically propagated to all associated registries.
- Integration with Monitoring Systems: Once registries are added to the GlobalRegistry, metrics are collected and exported to the respective monitoring systems.
How GlobalRegistry Works with a Spring Boot Application
In a Spring Boot application, the GlobalRegistry is typically not directly used because Spring Boot Actuator integrates its own MeterRegistry into the application context. However, it can still play a role in certain scenarios:
- Spring Boot Actuator’s Integration: Spring Boot automatically configures a MeterRegistry (e.g., PrometheusMeterRegistry) when you include dependencies like micrometer-registry-prometheus.
- Spring’s Managed Registry: By default, Spring does not use the GlobalRegistry. Instead, it manages its own MeterRegistry through the application context, ensuring tight integration with Spring components.
- Using GlobalRegistry in Spring Boot: You can explicitly add the Spring-managed MeterRegistry to the GlobalRegistry if you want global propagation of metrics.
When to Use GlobalRegistry in Spring Boot
- Third-Party Libraries: Libraries that are not tightly integrated with Spring can use the GlobalRegistry to register metrics. This ensures the metrics appear in the Spring-managed registries without additional configuration.
- Multi-Registry Scenarios: If you need to send metrics to multiple monitoring backends (e.g., Prometheus and Datadog), the GlobalRegistry can aggregate all MeterRegistry instances.
- Custom Metric Registration: Developers can use Metrics.globalRegistry to register metrics globally without injecting a specific MeterRegistry.
- The Spring-managed MeterRegistry can be added to the GlobalRegistry for seamless integration. However, for most Spring Boot applications, directly working with the Spring-managed MeterRegistry is sufficient.
Binders in Micrometer
In Micrometer, Binders are components that automatically collect metrics from common system components, frameworks, or libraries and register them with the MeterRegistry. They simplify the process of adding instrumentation for standard use cases, such as monitoring JVM resources, database connection pools, or cache systems.
A binder is essentially a prebuilt integration that:
- Collects specific metrics.
- Adds those metrics to the MeterRegistry.
- Requires minimal configuration from the developer.
Common Micrometer Binders

How Binders Work
Binders register metrics automatically when:
- A corresponding library or component is available in the application (e.g., HikariCP for DatasourceMetrics).
- The MeterRegistry is initialized.
- The binder is explicitly added or enabled.
Using Binders in a Spring Boot Application
Spring Boot Actuator includes many built-in binders, and they are auto-configured when the required dependencies are added.
Example: JVM Metrics and Datasource Metrics
1. Add Dependencies:
Add the required dependencies for Micrometer and the desired binders. For example:
<dependency>
    <groupId>io.micrometer</groupId>
    <artifactId>micrometer-core</artifactId>
</dependency>
<dependency>
    <groupId>io.micrometer</groupId>
    <artifactId>micrometer-registry-prometheus</artifactId>
</dependency>
<dependency>
    <groupId>org.springframework.boot</groupId>
    <artifactId>spring-boot-starter-actuator</artifactId>
</dependency>
2. Enable Metrics in application.properties:
Enable metrics exposure for Prometheus.
management.endpoints.web.exposure.include=prometheus
management.metrics.enable-all=true
3. Add Datasource Metrics:
If you’re using a database connection pool (e.g., HikariCP), metrics will be automatically registered.
Metrics like these will be available at /actuator/prometheus:
hikari_connections_active 10
hikari_connections_idle 5
hikari_connections_pending 3
4. Access Metrics:
The metrics collected by binders will be visible on the
- /actuator/metrics or
- /actuator/prometheus endpoint.
Why Use Binders?
1. Ease of Use:
- Reduces the effort required to instrument common components.
- Metrics are automatically collected without requiring custom logic.
2. Consistency:
- Ensures standard metrics across applications and frameworks.
- Allows for easier integration with monitoring tools.
3. Comprehensive Insights:
- Collects essential metrics for key components (JVM, databases, caches, etc.).
- Helps identify performance bottlenecks and system health issues.
Key Takeaways
- Binders are a plug-and-play solution to instrument common system components.
- Spring Boot Actuator simplifies the integration of many binders out-of-the-box.
- For manual setups or advanced use cases, binders can be explicitly registered in code.
Binders make it easy to adopt observability practices and ensure consistent metric collection across services.
Putting everything Together
Let’s explore how to implement a Micrometer Counter using Spring AOP and Java annotations. Below are the steps to automate a Counter for monitoring REST controllers:
- Define Custom Java Annotations: Create reusable annotations to be applied at the class and method levels.
- Develop an Aspect: Implement a Spring AOP aspect to intercept method invocations and integrate with the Micrometer Counter.
- Apply Annotations to REST Controllers: Annotate your REST controller classes or methods to enable automated metric collection.
1. Metrics Annotations
Metrics annotations provide a mechanism to control the collection of metrics for your APIs. These annotations are designed to be applied to your service methods, particularly REST endpoints in this example. Spring AOP will intercept these annotated methods and execute the necessary metrics logic, such as incrementing a counter to track the number of requests for each service. This enables seamless monitoring and analysis of API activity.
1.1. Metric Path — Code
Specifies the API path at the class level, providing a unified context for the metrics associated with the class
@Retention(RetentionPolicy.RUNTIME)
@Target({ElementType.TYPE})
public @interface MetricsPath {
    String name();       // Metric Name is Mandatory
}
1.2. Metric Counter — Code
Defines individual API endpoints along with tags to represent the metric dimensions, enabling detailed and granular tracking.
@Retention(RetentionPolicy.RUNTIME)
@Target({ElementType.METHOD})
public @interface MetricsCounter {
    String name() default "";       // Optional, can be extracted from MetricPath
    String endpoint();              // Endpoint is Mandatory
    String[] tags() default {};     // Add Tags for the Counter
}
2. Metric Aspect and Metric Counter Handler
2.1 Metric Aspect
- Purpose: Intercepts methods annotated with @MetricsCounter using AOP and increments a Micrometer Counter based on metadata extracted from the annotations.
Key Functions:
- Intercept Method Calls: Uses @Around advice to capture methods annotated with @MetricsCounter.
- Handle Metrics Logic: Delegates the logic of extracting metadata and managing counters to the MetricsCounterHandler.
- Increment Counter: Dynamically increments the counter for each method invocation.
  @Aspect
  @Component
  public class MetricsAspect {

    private final MeterRegistry meterRegistry;
    private final MetricsCounterHandler counterHandler;

    /**
     * Metrics Aspect Constructor
     * @param meterRegistry
     * @param counterHandler
     */
    public MetricsAspect(MeterRegistry meterRegistry, MetricsCounterHandler counterHandler) {
        this.meterRegistry = meterRegistry;
        this.counterHandler = counterHandler;
    }

    @Around("@annotation(MetricsCounter)")
    public Object trackCounter(ProceedingJoinPoint joinPoint) throws Throwable {
        MetricModel metricModel = counterHandler.getMetricModel(joinPoint);
        if(metricModel == null) {
            return joinPoint.proceed();
        }
        // Get Counter and Increment the Counter
        counterHandler.getCounter(metricModel.getMetricName(), metricModel.getMetricTags(), meterRegistry).increment();
        return joinPoint.proceed(); // Proceed with the method execution
    }
  }
MeterRegistry
- This is the central interface in Micrometer for managing and publishing metrics.
- The MeterRegistry is used here to create or retrieve counters that will be incremented based on method calls.
MetricsCounterHandler
- This is a custom helper class responsible for processing the @MetricsCounter annotation, extracting metadata, and handling counter creation.
- It encapsulates logic for building MetricModel and creating counters, keeping the aspect focused on AOP concerns.
2.2 Metric Counter Handler
- Purpose: Serves as a helper class to process metric metadata and manage Micrometer counters.
Key Functions:
Extract Metric Metadata:
- Combines information from class-level (@MetricsPath) and method-level (@MetricsCounter) annotations.
- Constructs a MetricModel containing the metric name, endpoint, and tags.
Retrieve/Create Counters:
- Checks the MeterRegistry for existing counters based on the metric name and tags.
- Dynamically creates new counters if none exist.
@Component
public class MetricsCounterHandler {

    /**
     * Get the Metric Meta-Data from the Annotations
     * @param joinPoint
     * @return
     */
    public MetricModel getMetricModel(ProceedingJoinPoint joinPoint) {
        MethodSignature signature = (MethodSignature) joinPoint.getSignature();
        // Check for class-level annotation first
        Class<?> targetClass = signature.getDeclaringType();
        MetricsPath metricClass = targetClass.getAnnotation(MetricsPath.class);
        // Check for method-level annotation
        MetricsCounter metricFunction = signature.getMethod().getAnnotation(MetricsCounter.class);

        String metricName = "METRIC-NAME-NOT-DEFINED";
        String name = "METRICS.PATH.NOT.DEFINED.";
        String endPoint = "METRICS.FUNCTION.NOT.DEFINED";
        String[] tags = null;
        // Extract Class Name and Method Name
        if (metricClass != null) {
            name = metricClass.name();
        }
        if (metricFunction != null) {
            if(metricFunction.name() != null && !metricFunction.name().trim().isEmpty()) {
                name = metricFunction.name();
            }
            endPoint = metricFunction.endpoint().replaceAll("/", ".");  // Use method endpoint
            metricName = name + endPoint;
            tags = metricFunction.tags();
        } else {
            // No annotation, proceed without tracking
            return null;
        }
        return new MetricModel(name, endPoint, "", tags, metricName);
    }

    /**
     * Create a Counter If it doesn't Exist or Retrieve the Counter based on Metric Name and Tags
     * @param name
     * @param tags
     * @param meterRegistry
     * @return
     */
    public Counter getCounter(String name, String[] tags, MeterRegistry meterRegistry) {
        // Retrieve or create the counter
        Counter counter = null;
        if(tags != null) {
            counter = meterRegistry.find(name).tags(tags).counter();
            if (counter == null) {
                // Create Counter if Not Found
                counter = Counter.builder(name)
                        .tags(tags)
                        .register(meterRegistry);
            }
        } else {
            counter = meterRegistry.find(name).counter();
            if (counter == null) {
                // Create Counter if Not Found
                counter = Counter.builder(name)
                        .register(meterRegistry);
            }
        }
        return counter;
    }
}
How They Work Together
- The MetricsAspect intercepts annotated methods.
- It calls MetricsCounterHandler.getMetricModel to extract metric metadata.
- Using the extracted metadata, it calls MetricsCounterHandler.getCounter to retrieve or create a counter in the MeterRegistry.
- The counter is incremented, and the original method proceeds.
Let’s now explore the REST Controller and examine how the annotations discussed in the first part function with REST endpoints. Similar to the Metric Counter, we can create annotations for other metrics like Gauges and Timers and implement handlers to integrate seamlessly with the Metric Aspect, resulting in cleaner and more maintainable code.
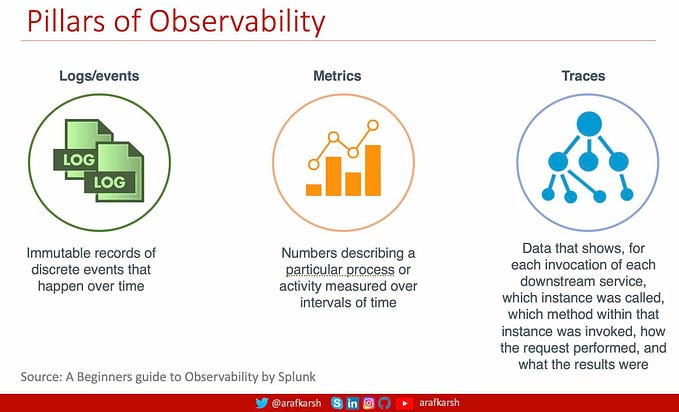
Does this introduce additional CPU overhead? Yes, it does. However, the insights gained from the collected data, especially when a large number of instances are running, far outweigh the slight increase in resource usage. Observability relies on three pillars: Logs/Events, Metrics, and Traces, all of which play a crucial role in ensuring system reliability and performance.
3. Applying Annotations to the REST Controllers
The @MetricPath and @MetricCounter annotations are custom annotations designed to facilitate metrics collection for observability purposes in a Spring REST Controller. They enable seamless integration with Micrometer or other metrics frameworks through aspects or interceptors.
3.1 MetricPath Annotation
- The @MetricPath annotation is applied at the class level to define a logical grouping or namespace for all metrics collected within that controller.
- It sets a base metric path that is shared across all endpoints in the controller.
@RequestScope
@MetricsPath(name = "fusion.air.cart")
public class CartControllerImpl extends AbstractController {- name = “fusion.air.cart”:
- Specifies the base name for all metrics originating from this controller.
- All metrics from the endpoints within this controller will be associated with the fusion.air.cart namespace.
3.2 MetricCounter Annotation
The @MetricCounter annotation is applied at the method level to define:
- Specific metrics for individual REST endpoints.
- Endpoint-specific tags to provide additional metadata for the metric (e.g., categorization or filtering).
It tracks metrics such as the number of requests made to the endpoint.
 @GetMapping("/all")
 @MetricsCounter(endpoint = "/all", tags = {"layer", "ws", "public", "yes"})
 public ResponseEntity<StandardResponse> fetchCarts() throws Exception {
 ... }

 @DeleteMapping("/delete/customer/{customerId}/cartItem/{cartId}")
 @MetricsCounter(endpoint = "/delete/customer/cartItem", tags = {"layer", "ws", "public", "no"})
 public ResponseEntity<StandardResponse> deleteCartItem(@PathVariable("customerId") String customerId,
                @PathVariable("cartId") UUID _cartId) {
  ... }
Use Case
This setup is used for automatic metrics tracking in a Spring Boot application:
- Developers only need to annotate methods with @MetricsCounter and define @MetricsPath at the class level.
- Counters are created or updated dynamically and are ready for export to observability systems like Prometheus, Datadog, or AWS CloudWatch.
In the “Putting it all together” section, we explored how Micrometer metrics can be seamlessly integrated into a Spring Boot application using annotations, Spring AOP (Aspects), and a custom metric handler.
We also demonstrated how to apply these annotations to REST controllers or various service layers, such as web, business, or database services. Next, we’ll delve into Actuator endpoints and examine how this data can be exported from your Spring Boot application to an external log or event management system for monitoring and analysis.
Spring Actuator Endpoints
Spring Boot Actuator provides built-in management endpoints that expose application metrics, health checks, configuration properties, and more. These endpoints are designed to integrate with monitoring systems, including Prometheus, by exposing Micrometer metrics in a format that Prometheus can scrape.
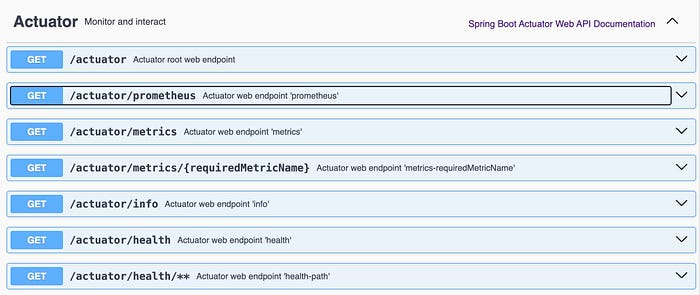
- /actuator : List all the following Actuator Endpoints
- /actuator/prometheus : Exposes metrics in a format suitable for Prometheus to scrape (requires micrometer-registry-prometheus).
- /actuator/metrics : Lists all available metrics in the application.
- /actuator/metrics/{name} : Provides detailed information about a specific metric (e.g., jvm.memory.used).
- /actuator/info : Displays arbitrary application information (e.g., version, environment details).
- /actuator/health : Reports the application health (e.g., database, external services).
Actuator Configurations in the Application Properties File
# ------------------------------------------------------------------------
# MicroMetrics / Prometheus / Actuator
# ------------------------------------------------------------------------
# Enable exposure of specific actuator endpoints (health, metrics, prometheus)
management.endpoints.web.exposure.include=health,metrics,prometheus,info
# Enable Spring Boot Actuator Endpoints
management.endpoint.health.enabled=true
management.endpoint.metrics.enabled=true
management.endpoint.prometheus.enabled=true
# Enable Metrics
management.metrics.export.prometheus.enabled=true
management.metrics.enable.jvm=false
management.metrics.enable.jvm.gc=false
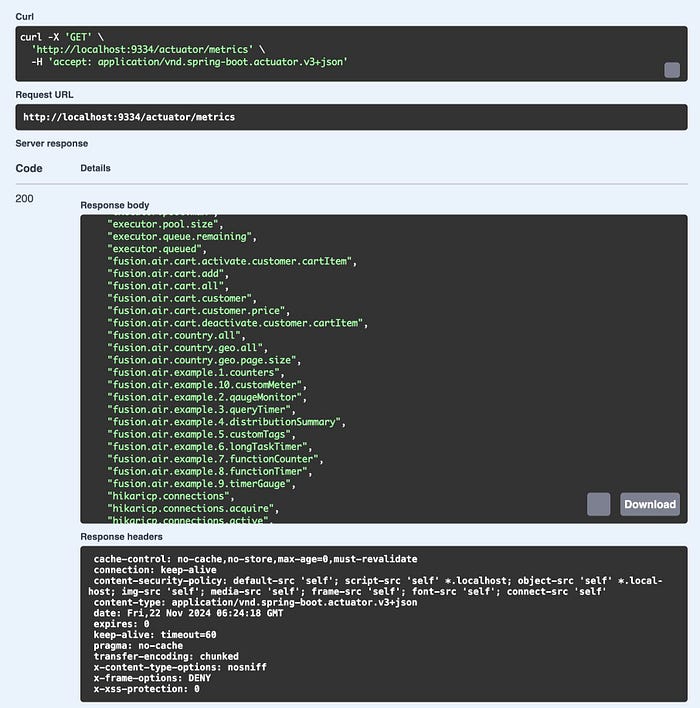
management.metrics.enable.datasource=falseMetrics Available in Actuator — /actuator/metrics
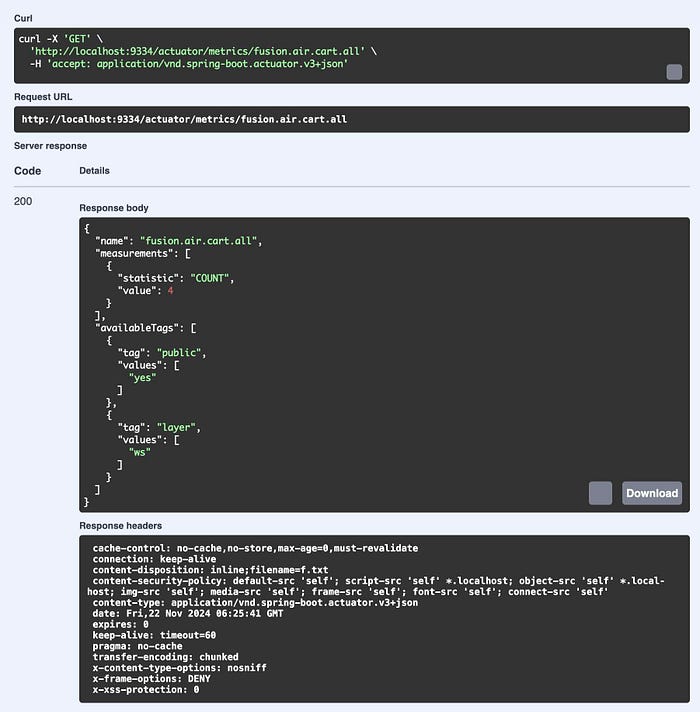
Querying Specific Metric in the Actuator — /actuator/metrics/{name}
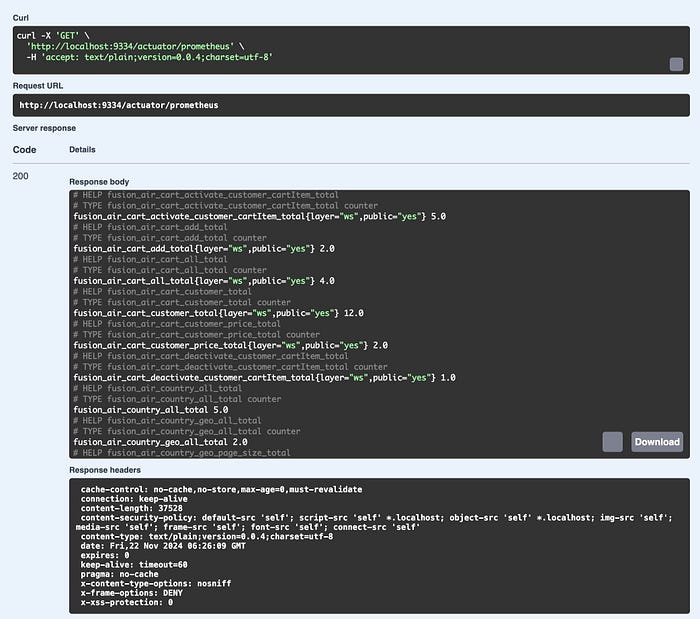
Querying Prometheus Endpoint in Actuator — /actuator/prometheus
Key Features of Actuator & Micrometer Metrics for Prometheus
- Built-in Metrics Collection: JVM, HTTP requests, datasource, and other system metrics are automatically collected.
- Custom Metrics Support: You can register custom counters, timers, and gauges using the MeterRegistry.
- Standard Prometheus Format: Metrics are exposed in a format that Prometheus can directly scrape and process.
- Easy Monitoring Setup: Minimal configuration to integrate with Prometheus and other monitoring tools.
Source Code: GitHub Repository: ms-springboot-334-vanilla — Microservice Template with SpringBoot 3.3.4 with Java 23 and Jakarta EE 10. NFRs — AOP, Exception, Logging, Micrometer, Crypto and Security (JWT) Framework.
Enjoy the week with a Cup of Java sprinkled with SpringBoot & AOP…
Java 23, SpringBoot 3.3.4 & Jakarta 10 Series
- Java 23, SpringBoot 3.3.4 & Jakarta 10 — Part 1
- Java 23, SpringBoot 3.3.4: AOP Exception Handling — Part 2
- Java 23, SpringBoot 3.3.4: Logback Setup — Part 3
- Java 23, SpringBoot 3.3.4: Log/Events: API Flow & Logging — Part 4
- Java 23, SpringBoot 3.3.4: Metrics: Micrometer, Prometheus, Actuator — Part 5
- Java 23, SpringBoot 3.3.4: Metrics: Micrometer & AOP — Part 6 (This article)
- Java 23, SpringBoot 3.3.4: Tracing: OpenTelemetry — Part 7
- Java 23, SpringBoot 3.3.4: Tracing: OpenTelemetry In Action — Part 8 Coming Soon
- Java 23, SpringBoot 3.3.4: Filters: Security, Log — Part 9 Coming Soon
- Java 23, SpringBoot 3.3.4: AOP: Spring Security — Part 10 Coming Soon
- Java 23, SpringBoot 3.3.4: CRUD — Part 11 Coming Soon
- Java 23, SpringBoot 3.3.4: CRUD Queries & Page Sort — Part 12 Coming Soon