Java 23, SpringBoot 3.3.4: Metrics: Micrometer, Prometheus, Actuator — Part 5
In this Java 23 series featuring Spring Boot 3.3.4 and Jakarta 10, we have explored the following topics so far:
- Part 1: Hexagonal Architecture implementation, along with API documentation using Swagger and OpenAPI.
- Part 2: Spring AOP (Aspect-Oriented Programming) for streamlined exception handling, standard HTTP responses, and comprehensive bean validation.
- Part 3: Logback Configuration using both file-based and console appenders for effective logging.
- Part 4: Log/Events: Development of RESTful Endpoints & understanding the API flow and AOP-driven logging for enhanced traceability.
- In Part 5 of this series, we’ll shift our focus to collecting metrics, building on the logging techniques we covered in Part 4. For metrics, we’ll use Micrometer, Prometheus, and Actuator.
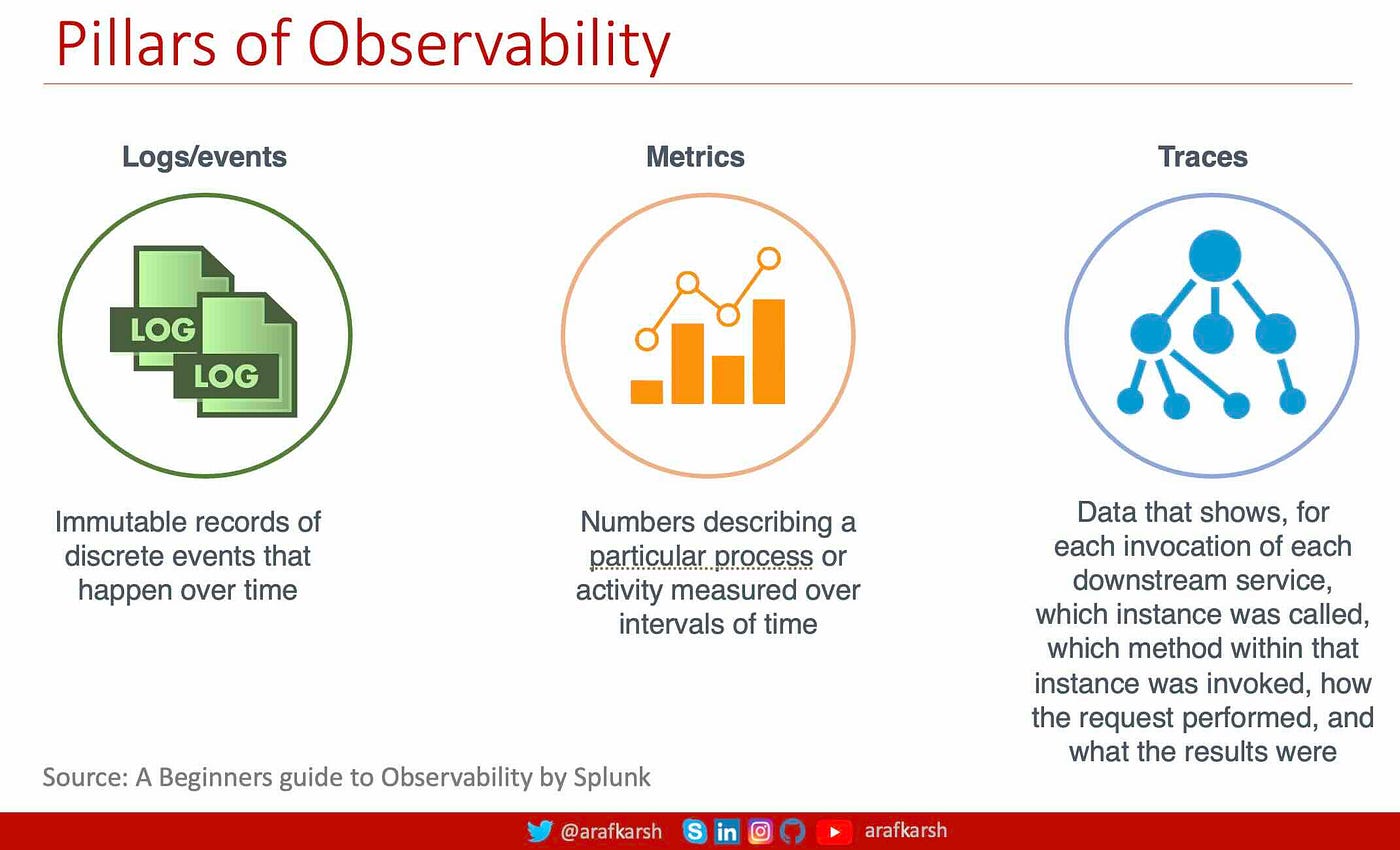
Pillars of Observability
The pillars of observability in a software system encompass three essential elements for effective monitoring and diagnosis: Logs/Events, Metrics, and Traces.
1. Logs/Events
- Logs or events are immutable records of discrete occurrences or activities in the system. They provide a chronological record of actions or errors that happened at specific points in time.
- Purpose: Logs help developers and operators understand the detailed actions and errors within the system, capturing both expected and unexpected events, which are critical for debugging and post-mortem analysis.
- Examples: Error logs, system startup messages, and request logs.
2. Metrics
- Metrics are numerical representations that quantify the behavior and performance of certain aspects of the system. They represent a particular process or activity over intervals of time.
- Purpose: Metrics provide quantitative data that helps in identifying trends, understanding performance issues, and monitoring system health. They are particularly useful for setting up alerts and thresholds.
- Examples: CPU usage, memory consumption, response time, request count, and error rates.
3. Traces
- Traces show the flow of a request as it moves through different services and components of a distributed system. Traces capture each invocation, identify which services and instances were involved, and provide insights into the performance of each step.
- Purpose: Tracing is essential for understanding dependencies and diagnosing latency issues in microservices or distributed architectures. It enables visibility into how requests propagate through the system and where bottlenecks or failures may occur.
- Examples: Distributed request flows, span data for each service invocation, and request latency per service.
Summary
These three pillars collectively enable observability in modern applications. Observability is crucial for maintaining, troubleshooting, and optimizing complex systems, particularly in distributed or microservices-based architectures. By having logs, metrics, and traces in place, organizations can proactively monitor system behaviour, quickly detect and resolve issues, and ensure optimal performance and reliability.
Let’s now explore the core components that enable metrics in a Spring Boot application: Micrometer, Prometheus, and Actuator. We’ll dive into each of these in detail.
Metrics Libraries for a SpringBoot Application
Micrometer acts as a metrics collection and instrumentation facade, seamlessly integrating with Spring Boot. It provides a unified API for defining and gathering metrics across diverse monitoring platforms. In a Spring Boot context, Micrometer instruments the application code, capturing data on JVM memory usage, CPU utilization, and HTTP request statistics. These metrics are then exposed through Actuator endpoints for easy access.
Prometheus, an open-source monitoring and alerting toolkit, is known for its reliability and scalability. Integrated with a Spring Boot application, Prometheus scrapes metrics from the Actuator’s /actuator/prometheus endpoint, enabling it to collect and store time-series data. This data can be queried and visualized, offering a clear view of the application’s performance and health.
Actuator brings production-ready capabilities to Spring Boot applications, offering endpoints that reveal essential operational data like health status, application metrics, and more. These endpoints simplify monitoring and management tasks, empowering developers and administrators to gain valuable insights into the application’s runtime behaviour.
Integration of all these libraries
- Micrometer Instrumentation: Developers use Micrometer to instrument the Spring Boot application, enabling the collection of key performance metrics.
- Metrics Exposure via Actuator: These collected metrics are made accessible through Actuator’s endpoints, with the /actuator/prometheus endpoint formatted specifically for Prometheus to process.
- Prometheus Scraping: Prometheus is set up to scrape data from the /actuator/prometheus endpoint at scheduled intervals, gathering metrics for analysis.
- Visualization and Alerts: The gathered metrics can be visualized with tools like Grafana and configured with alerts to support proactive monitoring of the application’s health and performance.
Properties for Micrometer, Prometheus & Actuator
In a Spring Boot application, the following properties configure the exposure and enablement of specific Actuator endpoints, as well as the integration with Prometheus for metrics monitoring:
# MicroMetrics / Prometheus / Actuator
# ------------------------------------------------------------------------
# Enable exposure of specific actuator endpoints (health, metrics, prometheus)
management.endpoints.web.exposure.include=health,metrics,prometheus,info
# Enable Spring Boot Actuator
management.endpoint.health.enabled=true
management.endpoint.metrics.enabled=true
# Enable Prometheus Metrics
management.endpoint.prometheus.enabled=true
management.metrics.export.prometheus.enabled=true
1. Expose Specific Actuator Endpoints:
- management.endpoints.web.exposure.include=health,metrics,prometheus,info
This property specifies which Actuator endpoints are exposed over HTTP. By default, only a limited set of endpoints are exposed. Setting this property to health,metrics,prometheus,info ensures that these specific endpoints are accessible via HTTP.
2. Enable Individual Actuator Endpoints:
- management.endpoint.health.enabled=true
- management.endpoint.metrics.enabled=true
- management.endpoint.prometheus.enabled=true
These properties enable the respective Actuator endpoints. Even if an endpoint is included in the exposure list, it must also be enabled to be accessible. Setting these properties to true ensures that the health, metrics, and prometheus endpoints are active.
3. Enable Prometheus Metrics Export:
- management.metrics.export.prometheus.enabled=true
This property enables integration with Prometheus by allowing the application to export metrics in a format that Prometheus can scrape. When set to true, the application exposes metrics at the /actuator/prometheus endpoint, which Prometheus can then collect for monitoring purposes.
Pom.xml file Configuration for Micrometer, Prometheus, & Actuator
<!-- .... Showing only relevant configurations ... -->
<properties>
  <!-- Logging ======================================================= -->
  <micrometer.version>1.13.5</micrometer.version>

  <!-- Spring Libraries ============================================== -->
  <spring.boot.version>3.3.4</spring.boot.version>
</prioperties>

 <dependencies>
  <!-- ================================================================= -->
  <!-- Micrometer /  Actuator      -->
  <!-- ================================================================= -->

  <!-- https://mvnrepository.com/artifact/io.micrometer/micrometer-core -->
  <dependency>
   <groupId>io.micrometer</groupId>
   <artifactId>micrometer-core</artifactId>
   <version>${micrometer.version}</version>
  </dependency>

  <!-- https://mvnrepository.com/artifact/io.micrometer/micrometer-registry-prometheus -->
  <dependency>
   <groupId>io.micrometer</groupId>
   <artifactId>micrometer-registry-prometheus</artifactId>
   <version>${micrometer.version}</version>
  </dependency>

  <!-- https://mvnrepository.com/artifact/org.springframework.boot/spring-boot-starter-actuator -->
  <dependency>
   <groupId>org.springframework.boot</groupId>
   <artifactId>spring-boot-starter-actuator</artifactId>
   <version>${spring.boot.version}</version>
  </dependency>

 </dependencies>
Micrometer Examples
1. Counter Example
This Java code snippet demonstrates the use of Micrometer’s Counter class to track the count of processed requests in a Spring Boot application.
@Component
public class _1_CounterExample {

    // @Autowired not required - Constructor based Autowiring
    private final Counter requestCounter;

    /**
     * Constructor for Autowiring
     * @param meterRegistry
     */
    public _1_CounterExample(MeterRegistry meterRegistry) {
        this.requestCounter = meterRegistry.counter("fusion.air.example.1.request.count");
    }

    public void processRequest() {
        // Business logic
        requestCounter.increment();
        // Increment the counter whenever a request is processed
    }
}
Code Breakdown
1. Class Definition (_1_CounterExample):
- The class _1_CounterExample contains the logic for tracking the number of times a specific event occurs, in this case, processing requests.
2. Counter Initialization:
- The requestCounter field is an instance of Micrometer’s Counter class, which will count occurrences of a specified event.
- The @Autowired annotation is not used here; instead, constructor-based dependency injection is used. This approach injects the MeterRegistry instance directly into the constructor.
3. Constructor (_1_CounterExample):
- The constructor takes MeterRegistry as a parameter. MeterRegistry is a central Micrometer component that manages all application metrics.
- Inside the constructor, meterRegistry.counter( “fusion.air.example.1.request.count”) creates a new counter metric named fusion.air.example.1.request.count. This counter will increment each time a request is processed.
4. Method (processRequest):
- The processRequest method represents a placeholder for business logic that processes requests.
- After completing the business logic, requestCounter.increment() is called to increase the counter by one, recording that a request has been processed.
Summary
- This example demonstrates a counter-based metric using Micrometer, which tracks the number of times an event (request processing) occurs.
- The MeterRegistry manages all metrics and allows the application to define custom metrics easily.
- Each time processRequest is called, the requestCounter increments, enabling real-time tracking of request counts, which can be monitored via Prometheus or another monitoring system compatible with Micrometer.
2. Gauge Monitor Example
This Java code example demonstrates using Micrometer’s Gauge to monitor the size of a queue in real-time within a Spring Boot application. A Gauge is a type of metric that measures the current value of a variable, which in this case is the size of a queue.
@Component
public class _2_GaugeMonitorExample {

    private final List<String> queue = new CopyOnWriteArrayList<>();

    /**
     * Constructor for Autowiring
     * @param meterRegistry
     */
    public _2_GaugeMonitorExample(MeterRegistry meterRegistry) {
        Gauge.builder("fusion.air.example.2.queue.size", queue, List::size)
                .description("Size of the Component Queue")
                .register(meterRegistry);
    }

    public void addToQueue(String item) {
        queue.add(item);
    }

    public void removeFromQueue(String item) {
        queue.remove(item);
    }
}
Code Breakdown
1. Class Definition (_2_GaugeMonitorExample):
- The _2_GaugeMonitorExample class monitors the size of a queue, which could represent a task or message queue in an application.
2. Queue Initialization:
- queue is a CopyOnWriteArrayList, a thread-safe variant of ArrayList, which allows safe modifications across multiple threads.
- The queue holds items added to it, and its size will be monitored.
3. Gauge Creation in Constructor:
- The constructor takes a MeterRegistry as a parameter to register the gauge.
- The Gauge.builder(…) call initializes a gauge metric named fusion.air.example.2.queue.size. This metric monitors the size of the queue list.
- “fusion.air.example.2.queue.size” is the metric name.
- queue is the object being monitored, and List::size is a method reference that returns the queue’s current size.
- The .description(“Size of the Component Queue”) method provides a human-readable description for the metric.
- The .register(meterRegistry) method registers this gauge metric with MeterRegistry, allowing it to be monitored by external systems like Prometheus.
4. Methods to Modify Queue (addToQueue and removeFromQueue):
- addToQueue(String item): Adds an item to the queue, increasing its size.
- removeFromQueue(String item): Removes an item from the queue, decreasing its size.
- Each of these methods dynamically adjusts the size of the queue, and the gauge metric will automatically reflect the updated size.
Summary
- This example uses Micrometer’s Gauge to track the current size of a queue.
- The gauge updates in real-time as items are added to or removed from the queue.
- This setup is particularly useful for monitoring components like task queues or buffer sizes, allowing developers to track metrics continuously via Prometheus or another monitoring tool compatible with Micrometer.
3. Query Timer Example
This Java code demonstrates using Micrometer’s Timer to monitor the time taken for a database query (or a simulated task) within a Spring Boot application. A Timer metric tracks both the count of events and their durations, making it ideal for timing operations like database queries, HTTP requests, or other time-bound processes.
@Component
public class _3_QueryTimerExample {

    // @Autowired not required - Constructor based Autowiring
    private final Timer queryTimer;

    /**
     * Constructor for Autowiring
     * @param meterRegistry
     */
    public _3_QueryTimerExample(MeterRegistry meterRegistry) {
        this.queryTimer = meterRegistry.timer("fusion.air.example.3.db.query.timer");
    }

    public void executeQuery() {
        queryTimer.record(() -> {
            // Simulating query execution
            try {
                Thread.sleep(1000);
            } catch (InterruptedException e) {
                e.printStackTrace();
            }
        });
    }
}
Code Breakdown
1. Class Definition (_3_QueryTimerExample):
- The _3_QueryTImerExample class sets up a timer to measure the duration of a query execution (simulated here with a Thread.sleep delay).
2. Timer Initialization:
- The queryTimer field is an instance of Micrometer’s Timer class, which will be used to record the duration of each query execution.
- The @Autowired annotation is omitted as constructor-based dependency injection is used here for dependency injection.
3. Constructor (_3_QueryTimerExample):
- The constructor takes a MeterRegistry parameter, which is required to register the timer metric.
- meterRegistry.timer(“fusion.air.example.3.db.query.timer”) initializes a new timer with the metric name fusion.air.example.3.db.query.timer.
- This timer will record each query execution time, making it trackable in a monitoring system.
4. Method (executeQuery):
- The executeQuery method contains logic that simulates a query execution.
- The queryTimer.record(…) method is used to time the execution within the lambda passed as a parameter.
- Inside the lambda, the code simulates a query by pausing execution for 1000 milliseconds (Thread.sleep(1000)). This represents the delay typically associated with database query execution.
- If interrupted, the exception is caught and printed.
Summary
- This example demonstrates how to use Micrometer’s Timer to measure the duration of specific events, like database queries.
- Each time executeQuery is called, the Timer records the duration of the simulated task.
- The timer metric tracks both the count of executions and the time taken for each, making it possible to monitor average query times, latency, and throughput using a tool like Prometheus or Grafana.
- This approach is particularly useful for performance monitoring in applications, as it provides valuable insights into how long certain tasks take, highlighting potential bottlenecks.
4. Distribution Summary Example
This Java code demonstrates how to use Micrometer’s DistributionSummary to track and analyze the sizes of payloads in a Spring Boot application. A DistributionSummary metric captures statistical data about a distribution, such as the count, total amount, and average of recorded values, making it well-suited for tracking metrics like payload sizes, request sizes, or data throughput.
@Component
public class _4_DistributionSummaryExample {

    // @Autowired not required - Constructor based Autowiring
    private final DistributionSummary payloadSummary;

    /**
     * Constructor for Autowiring
     * @param meterRegistry
     */
    public _4_DistributionSummaryExample(MeterRegistry meterRegistry) {
        this.payloadSummary = meterRegistry.summary("fusion.air.example.4.api.payload.size");
    }

    public void handleRequest(String payload) {
        payloadSummary.record(payload.length());
    }
}
Code Breakdown
1. Class Annotation (@Component):
- The _4_DistributionSummaryExample class is annotated with @Component, making it a Spring-managed bean. This allows Spring to automatically detect and manage this component, injecting dependencies where needed.
2. Distribution Summary Initialization:
- The payloadSummary field is an instance of Micrometer’s DistributionSummary class, which is used to track the distribution of payload sizes.
- The @Autowired annotation is not needed here because constructor-based dependency injection is used.
3. Constructor (_4_DistributionSummaryExample):
- The constructor accepts a MeterRegistry parameter, which registers the summary metric.
- Inside the constructor, meterRegistry.summary( “fusion.air.example.4.api.payload.size”) creates a new Distribution Summary metric with the name fusion.air.example.4.api.payload.size.
- This metric will be used to record the sizes of the payloads received, allowing monitoring tools to analyze the distribution of payload sizes over time.
4. Method (handleRequest):
- The handleRequest method simulates processing an incoming request payload.
- It takes a String parameter named payload (representing the data sent with a request) and records the length of this payload using payloadSummary.record(payload.length()).
- Each time handleRequest is called, the payload size is recorded, adding a data point to the distribution summary.
Summary
- This example illustrates the use of Micrometer’s DistributionSummary to track the distribution of payload sizes in an application.
- Each time handleRequest is invoked, the length of the payload is recorded, enabling the metric to capture the count, sum, average, and range of payload sizes.
- These metrics are useful for understanding data trends, such as typical request sizes, spikes, or outliers, and can be visualized using tools like Prometheus or Grafana to gain insights into request characteristics and potential bottlenecks.
5. Custom Tags Example
This Java code demonstrates how to use Micrometer’s Counter with custom tags in a Spring Boot application. Custom tags allow for additional dimensions in metrics, making it easier to filter, categorize, and analyze data by specific attributes, such as endpoints or response statuses.
@Component
public class _5_CustomTagsExample {

    // @Autowired not required - Constructor based Autowiring
    private final Counter taggedCounter;

    /**
     * Constructor for Autowiring
     * @param meterRegistry
     */
    public _5_CustomTagsExample(MeterRegistry meterRegistry) {
        this.taggedCounter = Counter.builder("fusion.air.example.5.customTags")
                // Tags are Key Value Pairs - Gives different dimensions for the metric
                .tags("endpoint", "/api/resource")
                .tags("status", "secured")
                .register(meterRegistry);
    }

    public void processTaggedRequest() {
        taggedCounter.increment();
    }
}
Code Breakdown
1. Class Annotation (@Component):
- The class _5_CustomTagsExample is annotated with @Component, indicating that it is a Spring-managed component. Spring will detect and manage this class, enabling dependency injection and integration with other application components.
2. Counter Initialization with Tags:
- The taggedCounter field is an instance of Micrometer’s Counter class, used to count the occurrences of a specific event, here, a “service request.”
- Instead of using @Autowired, the counter is injected through constructor-based dependency injection.
3. Constructor (_5_CustomTagsExample):
- The constructor accepts MeterRegistry as a parameter, allowing the application to register and manage metrics.
- Counter.builder(“fusion.air.example.5.tagged.service.requests”) initializes a counter with the metric name fusion.air.example.5.tagged.service.requests.
- .tags(“endpoint”, “/api/resource”) .tags(“status”, “secured”) adds custom tags to the counter:
- endpoint: Indicates the API endpoint associated with the request, here set to “/api/resource”.
- status: Represents the status of the request, which is tagged as “success” in this example.
- .register(meterRegistry): Registers the configured counter in the MeterRegistry, making it available for monitoring systems.
4. Method (processTaggedRequest):
- The processTaggedRequest method simulates processing a service request.
- Each time the method is called, taggedCounter.increment() increments the counter by one, recording a successful request for the specified endpoint.
Summary
- This example illustrates using a Micrometer Counter with custom tags in a Spring Boot application.
- Tags like endpoint and status add context to the metric, allowing for more detailed filtering and analysis in monitoring tools.
- Each call to processTaggedRequest increments the tagged counter, logging a successful request for the endpoint /api/resource.
- Monitoring systems like Prometheus or Grafana can use these tags to track requests per endpoint and filter by status, providing deeper insights into application performance and endpoint-specific request patterns.
Yes, in addition to Counter, Gauge, Timer, DistributionSummary, and Counter with tags, Micrometer offers several other useful concepts and features for monitoring metrics in a Spring Boot application. Here are some additional ones:
6. LongTaskTimer
- Purpose: Tracks tasks that may take a long time to complete, such as database migrations or large file processing, where duration may exceed the typical timeframe for regular Timer.
- Functionality: Unlike Timer, which measures short-duration events, LongTaskTimer can track multiple active tasks simultaneously and report on their durations.
LongTaskTimer longTaskTimer = LongTaskTimer.builder("fusion.air.example.6.longTaskTimer")
            .description("Tracks the duration of long-running tasks")
            .register(meterRegistry);
LongTaskTimer.Sample sample = longTaskTimer.start();
try {
    // Simulate long-running task
} finally {
    sample.stop();
}
7. FunctionCounter
- Purpose: A FunctionCounter dynamically measures the cumulative count of an event or process based on a given function. It is ideal for scenarios where you want to track a counter’s value derived from an object’s state or behavior without manually incrementing or decrementing it.
- Functionality: A FunctionCounter leverages a function to retrieve the current count, enabling real-time monitoring of metrics without explicitly maintaining the counter state. It simplifies tracking by dynamically reflecting the object’s count value, ensuring lightweight and flexible instrumentation.
// Create and register a FunctionCounter
FunctionCounter.builder("fusion.air.example.7.functionCounter", processingQueue, ProcessingQueue::getItemsProcessed)
      .description("Tracks the number of items processed from the queue")
      .tags("queue", "processing")
      .register(meterRegistry);
8. FunctionTimer
- Purpose: Measures both the count and total time of an operation based on a given function. It’s useful for monitoring processes where you can’t directly time the operation but have access to its count and duration metrics.
- Functionality: Combines the properties of a Counter and a Timer, allowing you to provide a count and total time function to calculate the rate and mean time of events.
 FunctionTimer.builder("fusion.air.example.8.functionTimer", timedObject,
    obj -> obj.getCount(), obj -> obj.getTotalTime(), TimeUnit.MILLISECONDS)
    .description("Measures the count and duration of events through functions")
9. TimeGauge
- Purpose: Similar to a Gauge but specifically intended to measure time-based values.
- Functionality: Instead of measuring arbitrary values, it reports a time-based measurement (e.g., time spent in a particular state or operation).
TimeGauge.builder("fusion.air.example.9.timerGauge", timedObject, TimeUnit.MILLISECONDS, TimedObject::getTotalTime)
      .description("Tracks the time spent in a specific state or process")
      .register(meterRegistry);
10. Custom Meters
- Purpose: Allows creating a custom metric type if none of the provided metric types meet your specific use case.
- Functionality: With Meter.Builder, you can define your own custom metric, giving full control over how the metric data is collected and represented.
  // Build and register the custom meter
  meter =  Meter.builder("fusion.air.example.10.customMeter", Meter.Type.OTHER, () -> {
        // Create measurements for success and failure counts
        return Arrays.asList(
                new Measurement(successCount::get, Statistic.COUNT),
                new Measurement(failureCount::get, Statistic.COUNT)
        ).iterator();
      })
      .description("Tracks the total success and failure requests")
      .tags(Tags.of("operation", "request.processing"))
      .register(meterRegistry);
11. Meter Filters
- Purpose: Provides a way to filter, transform, or disable metrics at the registry level, which is useful for tuning and refining your metrics.
- Functionality: Meter filters can be applied globally or per metric to include, exclude, or modify specific metrics based on rules
meterRegistry.config().meterFilter(MeterFilter.denyNameStartsWith("jvm"));
// This filter will exclude all metrics starting with "jvm" from being registered
12. Percentile and Histogram Support
- Purpose: Percentile and histogram support in Micrometer enables tracking of data distribution across a range of values, providing deeper insights into the performance and response time characteristics of metrics like Timer and DistributionSummary.
Functionality:
- Percentiles allow tracking specific percentiles (e.g., 90th, 95th) of a metric, giving a view of what response times or durations look like at specific points in the distribution.
- Histograms divide data into buckets to show a distribution of values over a set of ranges, which is valuable for visualizing and understanding data spread and detecting performance issues at different usage levels.
Timer timerWithPercentiles = Timer.builder("fusion.air.example.12.percentileHistogram.timer")
        .publishPercentileHistogram()
        .publishPercentiles(0.5, 0.9, 0.95) // Track 50th, 90th, and 95th percentiles
        .description("Response time with percentiles and histogram support")
        .register(meterRegistry);

DistributionSummary summaryWithHistogram = DistributionSummary.builder("fusion.air.example.12.percentileHistogram.ds")
        .publishPercentileHistogram()
        .publishPercentiles(0.75, 0.9, 0.99) // Track 75th, 90th, and 99th percentiles
        .description("Request size distribution with percentiles and histogram")
.register(meterRegistry);- Timer and DistributionSummary are configured with .publishPercentileHistogram() to enable histogram tracking, and .publishPercentiles(…) to specify particular percentiles (like 50th, 90th, 95th) that will be calculated.
- The Timer named “response.time” will record and track response times across different percentiles and with a histogram.
- The DistributionSummary named “request.size” tracks request sizes, providing both percentile and histogram data for a detailed view of distribution patterns.
Use Cases:
- Percentiles are valuable for understanding response times and ensuring SLAs, as they help identify outliers and measure performance at higher usage loads.
- Histograms provide a detailed distribution view of metric values, enabling developers to see the spread and identify thresholds where performance degradation might occur.
Percentiles and histograms are powerful features for applications requiring in-depth performance analysis and are essential in environments where understanding distribution patterns and outliers is crucial.
These additional Micrometer concepts enhance observability in a Spring Boot application, allowing fine-grained control over what is measured, how it’s tagged, and how data is structured and exported to monitoring systems.
In this session, we explored the capabilities of Micrometer in generating diverse metrics for your Spring Boot application. In the next session, we’ll dive into integrating these metrics with Spring AOP to achieve seamless, unified monitoring.
Enjoy the week with a Cup of Java sprinkled with SpringBoot & AOP…
Source Code: GitHub Repository: ms-springboot-334-vanilla — Microservice Template with SpringBoot 3.3.4 with Java 23 and Jakarta EE 10. NFRs — AOP, Exception, Logging, Micrometer, Crypto and Security (JWT) Framework.
Java 23, SpringBoot 3.3.4 & Jakarta 10 Series
- Java 23, SpringBoot 3.3.4 & Jakarta 10 — Part 1
- Java 23, SpringBoot 3.3.4: AOP Exception Handling — Part 2
- Java 23, SpringBoot 3.3.4: Logback Setup — Part 3
- Java 23, SpringBoot 3.3.4: Log/Events: API Flow & Logging — Part 4
- Java 23, SpringBoot 3.3.4: Metrics: Micrometer, Prometheus, Actuator — Part 5 (This article)
- Java 23, SpringBoot 3.3.4: Metrics: Micrometer & AOP — Part 6
- Java 23, SpringBoot 3.3.4: Tracing: OpenTelemetry — Part 7
- Java 23, SpringBoot 3.3.4: Tracing: OpenTelemetry In Action — Part 8 Coming Soon
- Java 23, SpringBoot 3.3.4: Filters: Security, Log — Part 9 Coming Soon
- Java 23, SpringBoot 3.3.4: AOP: Spring Security — Part 10 Coming Soon
- Java 23, SpringBoot 3.3.4: CRUD — Part 11 Coming Soon
- Java 23, SpringBoot 3.3.4: CRUD Queries & Page Sort — Part 12 Coming Soon
Further Research
- Spring Boot Features: Logging
- Spring Boot Logging: How to Guides
- Logback: Chapter 1: Introduction
- Logback: Chapter 2: Architecture
- Logback: Chapter 4: Appenders
- Spring Boot: Dispatcher Servlet