India 2050 — What do we need to do?

Lots of unemployed youth are a precursor to social unrest. Tamil Nadu is focused on skilling even though enrollment in Higher Education is double the National Average.
Palanivel Thiaga Rajan, Finance Minister, Tamil Nadu, Mar 18, 2023
You cant grow 9%-10% per year with 42% (213 Million / 21.3 Cr people) of the workforce depending on Agriculture. You need to move the population from Agriculture to Industry. Education / Health is a state subject, and every state must deliver, much like the Southern States did.
Amitabh Kant, India’s G20 Sherpa, x-CEO of Niti Aayog, March 18, 2023
I wrote an article on Jan 21st, 2005, about India’s Goals for 2020 with the backdrop of GDP and the issues with a large population (282 Million / 28.2 Cr people) still dependent on Agriculture.
Setting the Context
In 2004 India’s GDP Labour distribution for Agriculture was around 60% (282 Million / 28.2 Cr people), and in the last 20 years, we were able to reduce that to only 42%, approximately 213 Million (21.3 Cr) People. At the same time, China decreased that from 50% (389 Million in 2004) to 27% (219 Million people in 2021).
Another surprising factor is even though we overtook the Chinese in terms of Population, the Govt stats show that our workforce is only 507 million (50.7 Cr) people, while the expected workforce is around 800 million (80 Cr) people, Chinese Total Labor force is around 791 Million people (79.1 Cr).
Our workforce is expected to be around 800–900 million in the next 5–10 years. The worrying question is what will be the labor force distribution in 2030–35 (assuming 800 million people) and what percentage of that workforce will be in Agriculture. 40% of 800 Million will be around 320 Million, or 35% labor force (Agriculture) will be approximately 280 Million people. The Entire US population is about 340 Million. The issue is we are already struggling with a large labor force in Agriculture, and we need to move them into Industry.
Now let us look at the table to compare India and China’s progress in the last 20 years. The focus is on the GDP distribution to the economy and labor distribution in each sector (Agriculture, Industry & Services).

The above chart shows our progress from 2004 to 2023, almost two decades, and we reduced our Labor force in Agriculture from 60% to 42%. Still, That’s quite a large population in the workforce. 42% of 507 Million is 213 million workers.
Here is an interesting question. We overtook China’s population (1.4 Billion people), and yet our Labor force is only 36%of our population while China’s is 50%, a missing Labor force of close to 300 million people.
Please listen to the India Today Conclave 2023 discussion on 4D Democracy, Demography, Digitisation & De-Globalization, by Amitabh Kant (X-CEO Niti Aayog) and Palanivel Thiaga Rajan (Finance Minister, Tamil Nadu). In the blog I wrote in 2005, I mentioned the importance of moving the Agriculture Labor force into Industry and Services. Finally, after two decades, Amitabh Kant (former CEO of Niti Aayog and India’s G20 Sherpa in 2023) echoed the same sentiment, and that’s a good sign.
Lots of unemployed youth are a precursor to social unrest. Tamil Nadu is focused on skilling even though enrollment in Higher Education is double the National Average.
Palanivel Thiaga Rajan, Finance Minister, Tamil Nadu, Mar 18, 2023

You cant grow 9%-10% per year with 42% of the workforce depending on Agriculture. You need to move the population from Agriculture to Industry. Education / Health is a state subject, and every state must deliver, much like the Southern States did.
Amitabh Kant, India’s G20 Sherpa, x-CEO of Niti Aayog, March 18, 2023
This article is divided into 3 sections — RRR
- Reality: India and the State of States (Niti Aayog & NFHS)
- Reverberation: Interviews from Politicians, Bureaucrats, Economists
- Realization: Consumption Expenditure, Education (UDISE+)
Now the context is set — we have a vast workforce dependent on Agriculture and how we move them into Urbanized Manufacturing (Industry). Let us review the data from Niti Aayog and NFHS (National Family Health Survey 4 & 5) and see how the Indian states compare in Education and Healthcare.
1. Reality: India & the State of States (Niti Aayog & NFHS)
The United Nations’ Sustainable Development Goals (SDGs) are a collection of 17 interconnected global goals designed to address various challenges, including poverty, inequality, environmental degradation, and health. Adopted by all 193 UN member states in September 2015 as part of the 2030 Agenda for Sustainable Development, the SDGs aim to provide a roadmap for countries to work together and create a better world for all. In India, the federal system involves States and Union Territories (UTs) playing a significant role in implementing and achieving the SDGs.
NITI Aayog, as India’s nodal institution for the SDGs, has been instrumental in providing encouragement and support to the States and UTs to ensure progress on various SDG targets. Since 2018, the SDG India Index & Dashboard has served as a powerful tool for integrating the SDGs into the policy arena of the States and UTs. The Index has become an essential instrument for measuring the progress of the States and UTs, providing inputs for evidence-driven action toward the attainment of the SDGs.
The SDG India Index & Dashboard has also instilled a spirit of competition among sub-national constituents, motivating them to strive for excellence in their efforts to achieve the goals. This competitive environment has helped drive progress on various SDG targets, ensuring that India’s States and UTs continue to make gains in their pursuit of sustainable development.
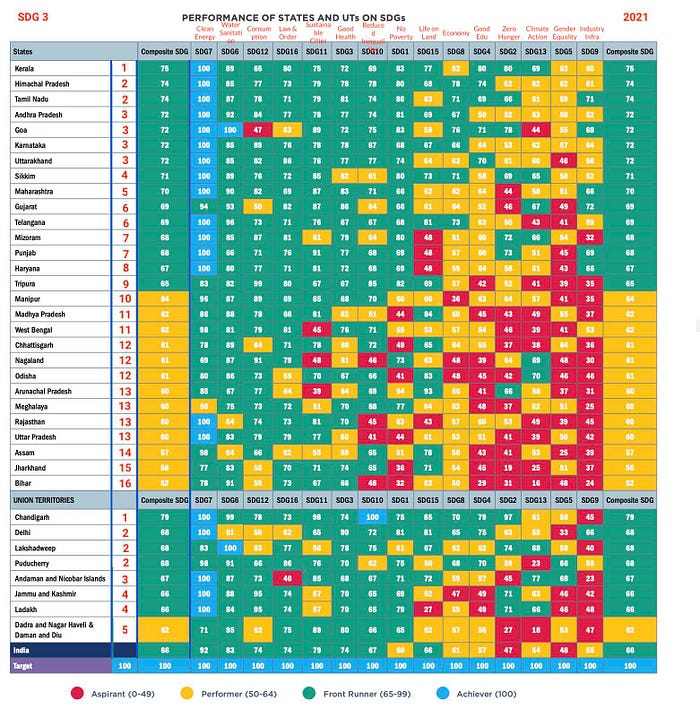
Niti — National Institution for Transforming India replaced the 5-year planning commission. Now let us look at the overall rankings based on the SDGs by Niti Aayog.
State of States 2021 — Niti Aayog (2021)
Kerala ranked #1, while Himachal Pradesh and Tamil Nadu ranked #2. These states (especially Kerala & Tamil Nadu) emphasize Pro-People Economic Model, also known as the Kerala Model of Development or Dravidian Development Model.
Check out the Sustainable Development Goals — SDG2 (Zero Hunger), SDG4 (Education), and SDG9 (Industry, Innovation & Infrastructure). We will see why these SDGs are essential when you want to move the Labor Force from Agriculture to Industry.
#1. Kerala — 2021
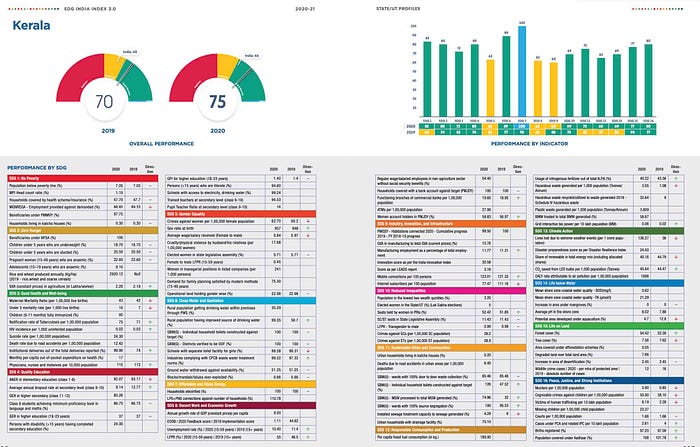
Kerala has maintained the #1 position for decades in multiple studies (Niti Aayog, India Today State of States). Out of 15 SDGs (United Nations Sustainable Developmental Goals), Kerala got 11 in Green, 1 in blue, and 3 in Yellow.
The population below MPI (Multidimensional Poverty Index) is 1.10%. Kerala put much effort into Education and Healthcare from the 1950s onwards. Some of the critical reforms were brought through bills like Land Reforms Act, Education Bill, and Panchayat Raj Bill. We will learn more about these in the “Realization” section.
#2. Tamil Nadu — 2021
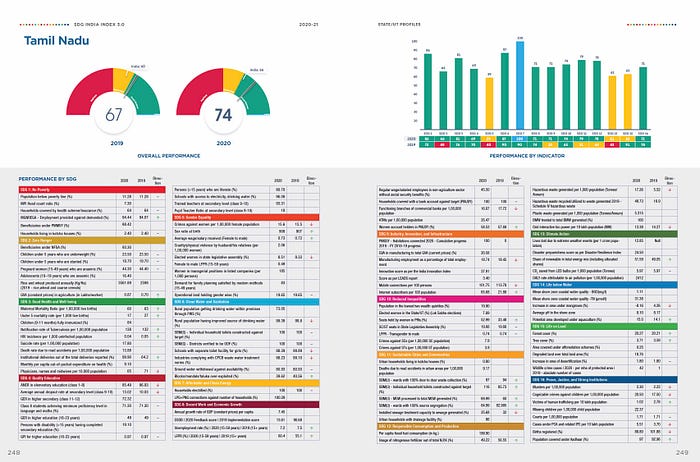
With a single point behind Kerala, Tamil Nadu has done exceptionally well in education, healthcare, and industrialization.
#13. Uttar Pradesh — 2021
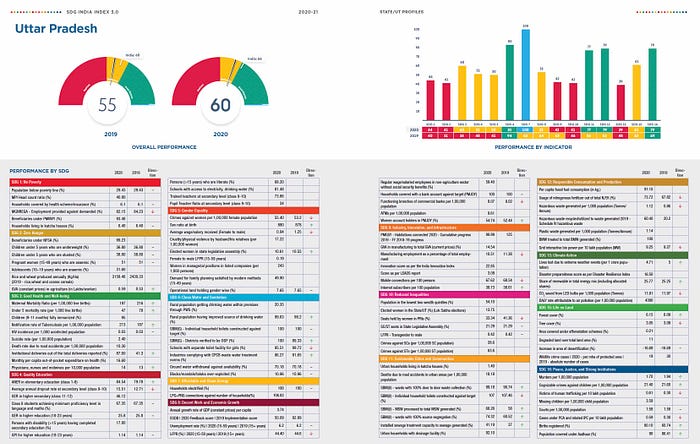
Uttar Pradesh ranks #13 and has five SDGs marked in red, indicating that significant efforts must be directed toward improving the state's education and healthcare.
In SDG1 (No Poverty), 40.80% (93.8 Million / 9.38 Cr people) of the population is in the Multidimensional Poverty Index, and 29.43% (69 Million people / 6.9 Cr people) of the population is below the poverty line. Considering the population of Uttar Pradesh (234.7 Million / 23.4 Cr people), that's quite a considerable number of people in MPI and below the poverty line.
In SDG4 (Education), the ANER (Adjusted Net Enrollment Rate) in primary Education (Class 1–8) is around 84.54%, and the Average annual dropout rate in the secondary class (Class 9–10) is around 15%. GER (Gross Enrollment Ratio) in the higher secondary (Class 11–12) is only 46.12%, while the GER in higher education (18–23) is only 25.8%. Moving the workforce into Industry requires transforming the young generation (15–23 years old) with better Education and adequate skill sets.
#16. Bihar- 2021
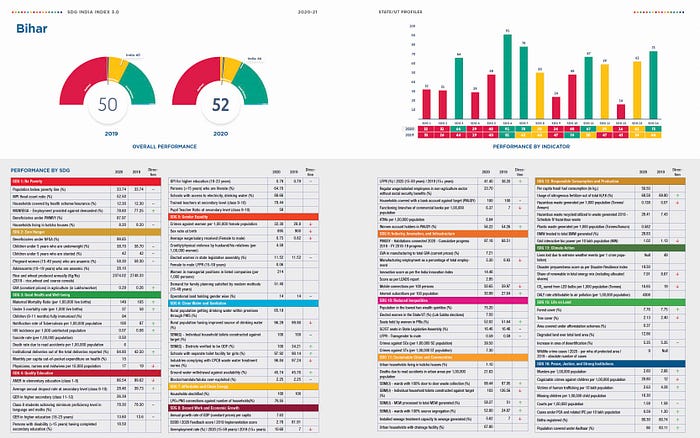
Bihar ranks #16 and has 7 SDGs in red and 3 in Yellow, meaning almost half of the Goals are in Red and have a long way to go.
In SDG1 (No Poverty), 52.50% (66.51 Million / 6.65 Cr people) of the population is in the Multidimensional Poverty Index, and 33.74% (42.69 Million people / 4.27 Cr people) of the population is below the poverty line. Considering the population of Bihar (126.7 Million / 12.67 Cr people), that’s quite a considerable number of people in MPI and below the poverty line.
In SDG4 (Education), the ANER (Adjusted Net Enrollment Rate) in primary Education (Class 1–8) is around 86.54%, and the Average annual dropout rate in the secondary class (Class 9–10) is around 28.46%. GER (Gross Enrollment Ratio) in the higher secondary (Class 11–12) is only 26.39%, while the GER in higher education (18–23) is only 13.60%. Moving the workforce into Industry requires transforming the young generation (15–23 years old) with better Education and adequate skill sets.
India’s GDP Distribution 2004, 2012 2021
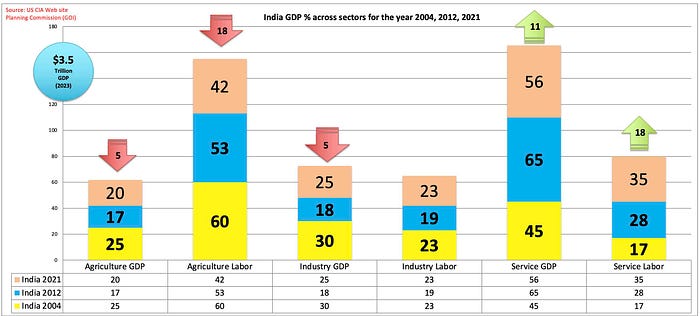
The above chart shows the GDP Distribution across Agriculture, Industry, and Services for 2004, 2012, and 2021.
- Agriculture's contribution to GDP decreased from 25% in 2004 to 20% in 2021. In contrast, the contribution of the Labor force got reduced from 60% in 2004 to 42% in 2021.
- Industry contribution to GDP decreased from 30% in 2004 to 25% in 2021. In contrast, the contribution of the Labor force remained the same at 23% even though there was a dip in 2012 to 19%.
- Service (and others) contribution to GDP increased from 45% in 2004 to 56% in 2021, while the contribution of the Labor force increased from 17% in 2004 to 35% in 2021.
The most important factor over here is there wasn't any movement in the Labor force in the Industry sector. What we need is to move the labor force from Agriculture to Industry.
Niti Aayog — MultiDimensional Poverty Index — 2021
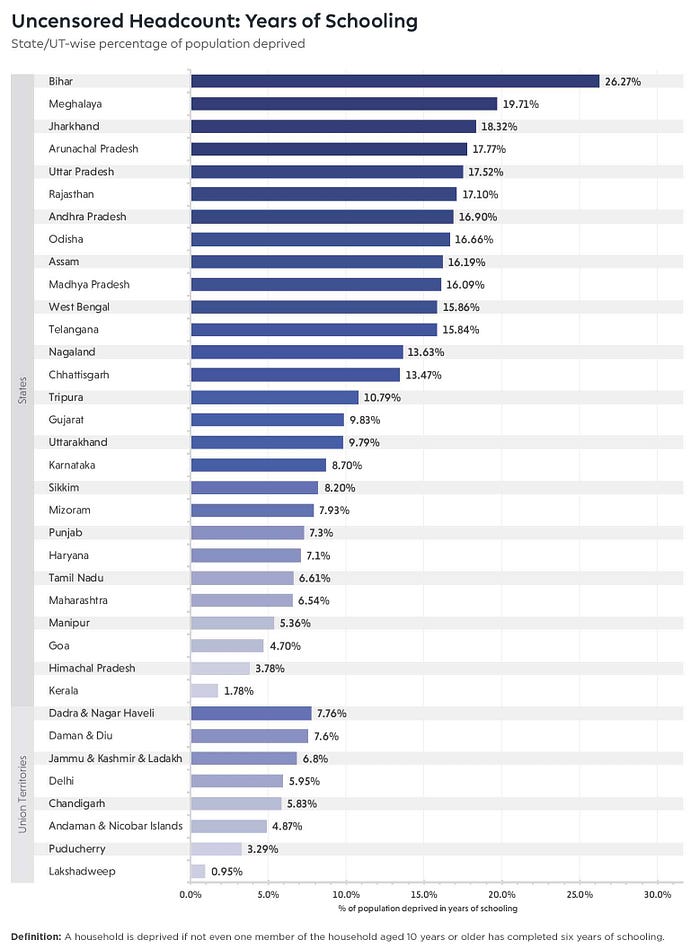
% of the Population deprived of Schooling (6 Years)
A household is deprived if not even one family member aged 10 years or older has completed six years of Schooling.
Among the large states
- Bihar (2021–126.7 Million / 12.67 Cr People)
- Uttar Pradesh (2021–234.7 Million / 23.4 Cr People)
- Madhya Pradesh (2021–85.3 Million / 8.53 Cr People)
- Jharkhand (2021–39.4 Million / 3.94 Cr People)
need to put more emphasis on Education and focus on spending more on Education than other activities.
Compare this to Kerala (Population 2021–34.84 Million or 3.48 Cr), only 1.7% is deprived of Schooling.
Schooling Deprived percentage
- Bihar (26.7%) = 33.82 Million or 3.38 Cr People
- Jharkhand (18.32%) = 7.21 Million or 0.7 Cr People
- Madhya Pradesh (16.09%) = 13.72 Million or 1.37 Cr People
- Uttar Pradesh (17.5%) = 41.0 Million or 4.1 Cr People
Just these 4 states will give you a total of 95.75 Million people or 9.57 Cr people with Schooling deprived. The number will be higher if you calculate other states too.
The total population of Some European Countries
- Germany — 83.2 Million or 8.32 Cr People
- France — 67.7 Million or 6.77 Cr People
- UK — 67.3 Million or 6.73 Cr People
We have a severe problem on our hands to solve. This transformation where we need to move people (213 million Labor force) from Agriculture to Industry requires proper Education / Skillset training, which will take a decade or two.
Niti Aayog 2021 based on National Family Health Survey 4 (2015–16)
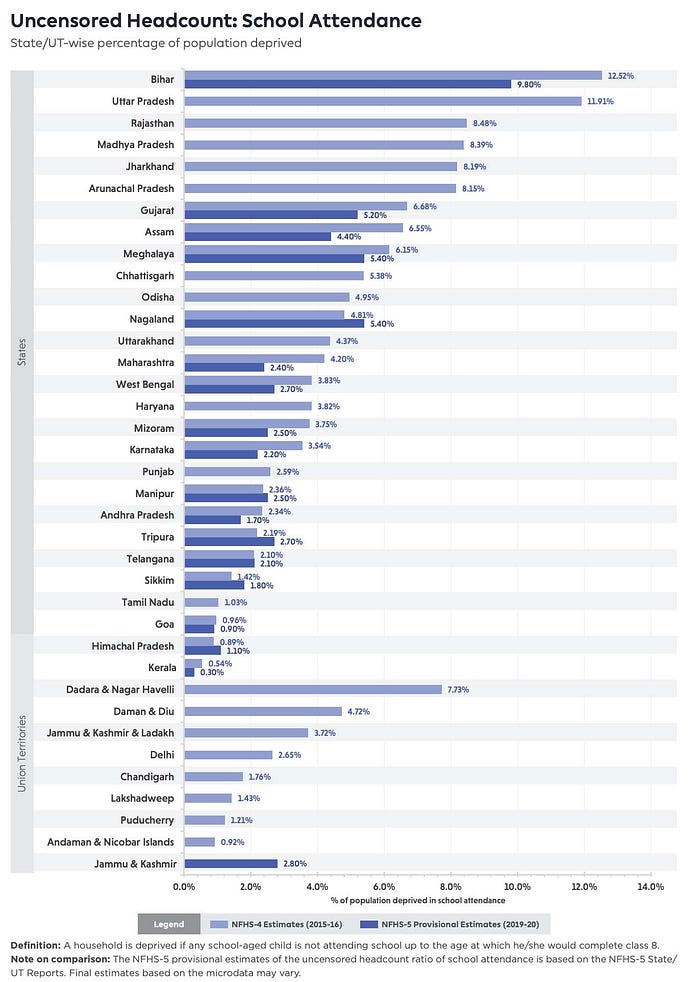
School Attendance
A household is deprived if any school-aged child is not attending school up to the age at which they would complete class 8.
The indicator for school attendance is the logical precursor to the indicator for years of Schooling. A child not attending school indicates both the presence of deprivations experienced by the household and the possible future deprivations resulting from the child not attending school. A child not attending school is symbolic of a more significant set of deprivations experienced by the household that impedes the child’s Education. Similarly, because the child is not attending school, the household members will be deprived of the positive externalities of having a formally educated member.
An individual living in a household with at least one child not attending school is treated as deprived in this indicator, even though they may have completed Schooling.
I introduced this chart because it has provisional data from National Family Health Survey-5 2019–20. The critical issue is whether the data is from NFHS-4 or NFHS-5. The Northern States need to do a lot in terms of Education and Healthcare. You can compare that with Kerala and Tamil Nadu.
- Bihar (2021–126.7 Million / 12.67 Cr People)
- Uttar Pradesh (2021–234.7 Million / 23.4 Cr People)
- Rajasthan (2021–81.18 Million / 8.11 Cr People)
- Madhya Pradesh (2021–85.3 Million / 8.53 Cr People)
- Jharkhand (2021–39.4 Million / 3.94 Cr People)
Niti Aayog 2021 based on National Family Health Survey 4 (2015–16) & National Family Health Survey 5 (2019–20)
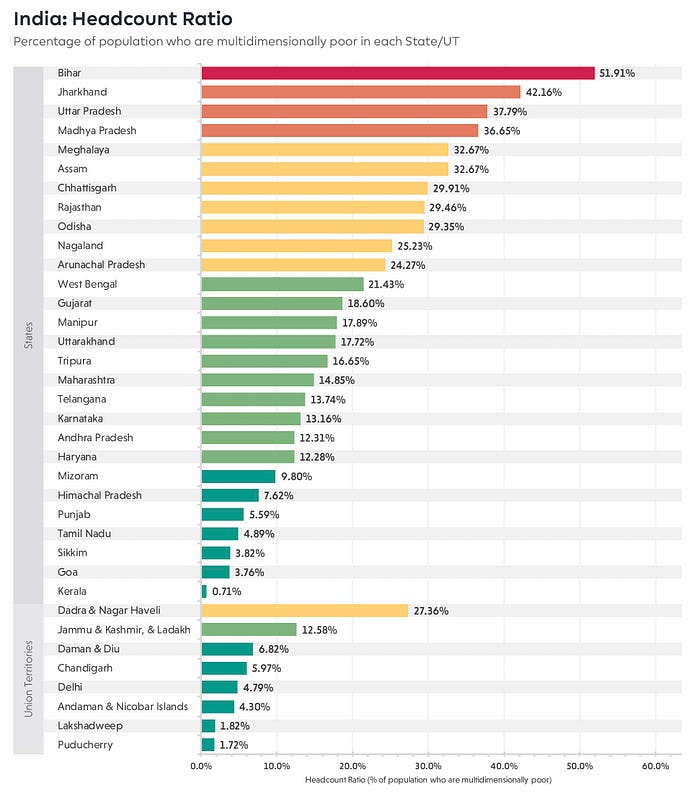
Niti Aayog — % of Population Poor in Each State
Multidimensionally Poor
Multidimensional poverty encompasses more than just lack of income and considers other factors such as lack of access to basic needs like Education, Healthcare, and clean water. For instance, a family living in a slum with inadequate housing, limited access to clean water, no healthcare or Education, and facing discrimination would be considered multidimensionally poor, even if their income was above the poverty line. In short, multidimensional poverty looks beyond income to capture the various dimensions of deprivation that people experience.
In September 2015, the United Nations General Assembly passed a resolution establishing the 17 Sustainable Development Goals (SDGs). SDG 1, which aims to “End poverty in all its forms everywhere,” has multiple dimensions and definitions. Target 1.1 of SDG 1 seeks to eliminate extreme poverty, measured as people living on less than $1.25 daily (later increased to $1.90/day). Meanwhile, Target 1.2 aims to reduce multidimensional poverty, as defined by national definitions, by 50%.
Those SDGs are in the Niti Aayog Report State of States 2021. Kerala (#1) got a score of 83 (SDG1 — No Poverty), while Bihar (32), Jharkhand (36), and UP (44).
- Bihar (MPI Poor 51.91%) = 65.75 Million or 6.57 Cr People
- Jharkhand (MPI Poor 42.16%) = 16.58 Million or 1.65 Cr People
- Uttar Pradesh (MPI Poor 37.79%) = 88.69 Million or 8.86 Cr People
- Madhya Pradesh (MPI Poor 36.65%) = 31.26 Million or 3.12 Cr People
That’s a total of 202.28 Million or 20.22 Cr people multidimensionally poor from the first 4 states combined, which is close to the total population of Maharashtra (128.5 Million / 12.85 Cr) and Tamil Nadu (82.07 Million / 8.20 Cr) combined.
Niti Aayog 2021 based on National Family Health Survey 4 (2015–16)
Multidimensional Poverty Index — 2021
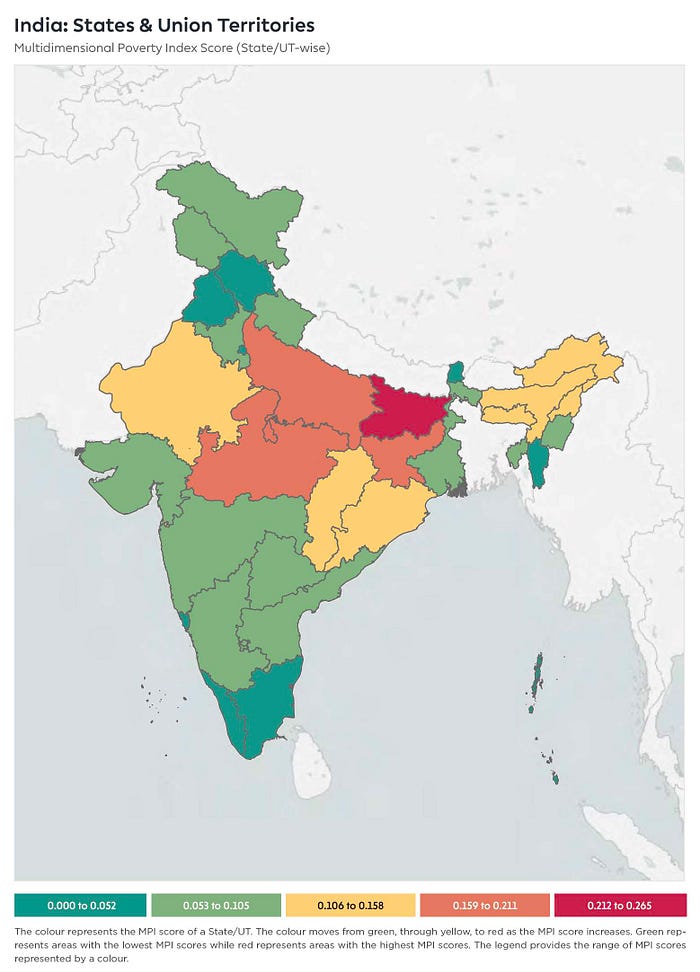

The importance of the above Map is the Rural Areas. Kerala, Tamil Nadu, Punjab & Uttarakhand also performed better in Rural areas. This means the Government initiatives in those states were inclusive in nature.
Healthcare — India based on NFHS Data
Infant and child mortality rates are crucial indicators to assess the overall health of a state or country. They are often used to gauge the effectiveness of public health policies, access to healthcare, and the general well-being of a population. These rates can provide valuable insights into various aspects of a society’s health, including:
- Quality of healthcare: High infant and child mortality rates may indicate inadequate prenatal care, insufficient access to quality healthcare services, or a lack of trained healthcare professionals.
- Socioeconomic factors: These rates can reflect disparities in income, education, and access to resources, which can influence the overall health of a population. Higher mortality rates are often seen in areas with higher poverty levels and lower education levels.
- Public health policies: Effective public health policies can significantly reduce infant and child mortality rates. High rates can indicate a need for more effective or comprehensive policies, including vaccination programs, proper sanitation, and access to clean drinking water.
- Nutritional status: Malnutrition can contribute to increased infant and child mortality rates, as it weakens the immune system and increases susceptibility to infections. High rates can indicate inadequate access to food or insufficient nutrition education.
- Disease prevalence: High infant and child mortality rates may be indicative of a high prevalence of infectious diseases, such as malaria, pneumonia, and diarrhea, which can be particularly harmful to young children.
- Environmental factors: Poor environmental conditions, such as pollution and lack of access to clean water, can contribute to increased mortality rates, as they can lead to various health problems.
- By monitoring infant and child mortality rates, policymakers and healthcare professionals can identify areas of concern and direct resources to improve overall health and well-being. Reducing these rates is essential to global development goals, such as the United Nations’ Sustainable Development Goals, which aim to improve health outcomes and reduce inequalities worldwide.
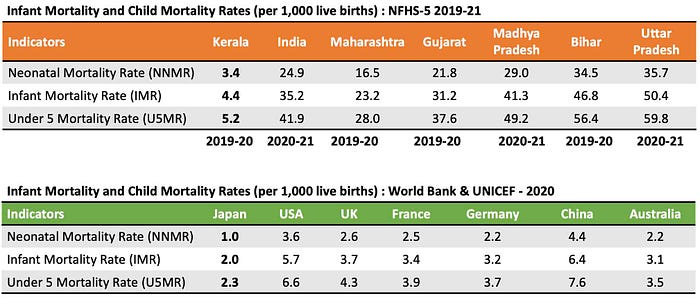
NFHS 5–2019–21 (National Family Health Survey)
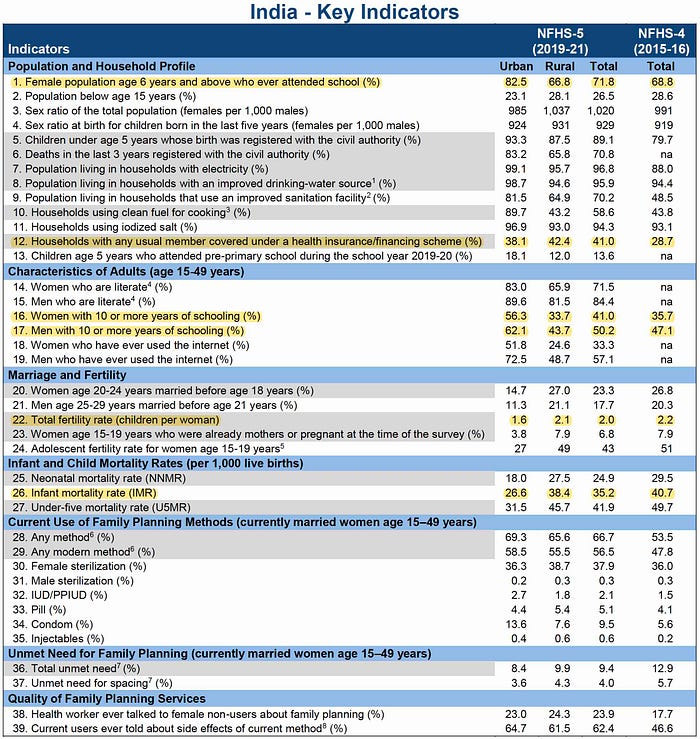
Look at indicators 16 and 17, which reflect the overall Education system the states implemented. Over 50% of the Population has yet to go beyond 10 years of Schooling. The Infant Mortality Rate (Indicator 26) is 35.2 per 1,000 live births, reflecting the overall health. In the developed nations, this indicator is in single digits as per the data from World Bank.
Infant Mortality Rate (IMR) in Developed Nations
- United States: 5.5 deaths per 1,000 live births
- United Kingdom: 3.8 deaths per 1,000 live births
- France: 2.8 deaths per 1,000 live births
- Germany: 2.9 deaths per 1,000 live births
- New Zealand: 3.7 deaths per 1,000 live births
- China: 6.8 deaths per 1,000 live births
Kerala is the only state with Infant Mortality Rate in a single digit — 4.4 deaths per 1,000 live births per NFHS-5 2019–20 data which is better than the US (5.5) and close to the UK (3.8). The Infant Mortality Rate in Urban areas in Kerala is 3.5 per 1,000 live births and 5.2 in Urban areas.
As per WHO (World Health Organization), Infant mortality represents an essential component of under-five mortality. Like under-five mortality, infant mortality rates measure child survival. They also reflect the social, economic, and environmental conditions in which children (and others in Society) live, including their health care.
NFHS 5–2019–20 Kerala and Tamil Nadu
Kerala — 3.48 Cr / 34.84 Million people (2021)
- 51% have health insurance
- 75% have 10 or more years of Schooling
- The infant Mortality Rate is 4.4 per 1,000 live births
- Total Fertility Rate 1.8 (Children per woman)
- https://www.census2011.co.in/census/state/kerala.html
Tamil Nadu — 8.20 Cr / 82.07 Million People (2021)
- 71% have health insurance
- 58% have 10 or more years of Schooling
- The infant Mortality Rate is 21.7 per 1,000 live births
- Total Fertility Rate 1.8 (Children per woman)
- https://www.census2011.co.in/census/state/tamil+nadu.html
NFHS 5–2019–20 Gujarat and Maharashtra

Gujarat — 7.07 Cr / 70.7 Million people (2021)
- 39% have health insurance
- 40% have 10 or more years of Schooling
- The infant Mortality Rate is 31.2 per 1,000 live births
- Total Fertility Rate 1.9 (Children per woman)
- https://www.census2011.co.in/census/state/gujarat.html

Maharashtra- 12.85 Cr / 128.5 Million People (2021)
- 20% have health insurance
- 55% have 10 or more years of Schooling
- The infant Mortality Rate is 23.2 per 1,000 live births
- Total Fertility Rate 1.7 (Children per woman)
- https://www.census2011.co.in/census/state/maharashtra.html
NFHS 5–2019–20 Jharkhand and Madhya Pradesh
Jharkhand — 3.94 Cr / 39.4 Million people (2021)
- 50% have health insurance
- 40% have 10 or more years of Schooling
- The infant Mortality Rate is 37.9 per 1,000 live births
- Total Fertility Rate 2.3 (Children per woman)
- https://www.census2011.co.in/census/state/jharkhand.html
Madhya Pradesh — 8.53 Cr / 85.3 Million People (2021)
- 38% have health insurance
- 35% have 10 or more years of Schooling
- The infant Mortality Rate is 41.3 per 1,000 live births
- Total Fertility Rate 2.0 (Children per woman)
- https://www.census2011.co.in/census/state/madhya+pradesh.html
NFHS 5–2019–20 Bihar and Uttar Pradesh
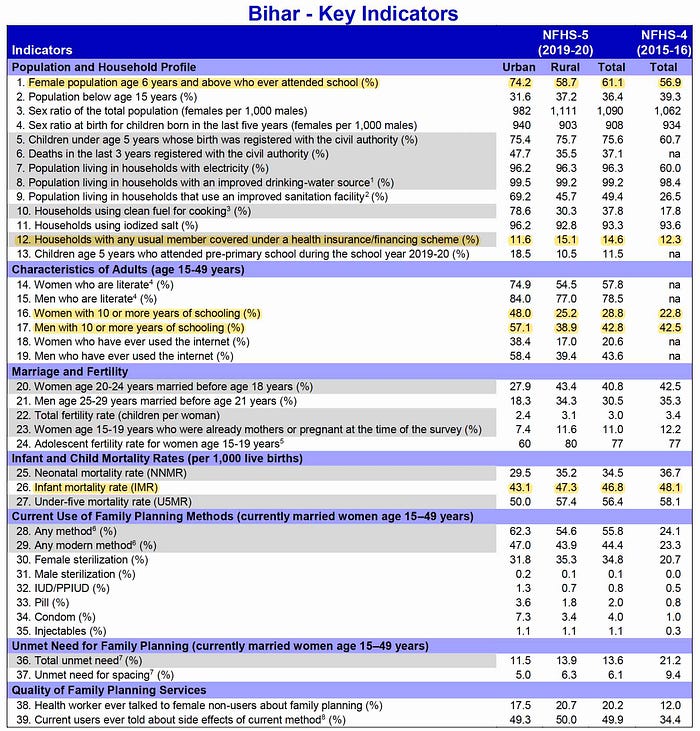
Bihar — 12.67 Cr / 126.7 Million people (2021)
- 15% have health insurance
- 36% have 10 or more years of Schooling
- The infant Mortality Rate is 46.8 per 1,000 live births
- Total Fertility Rate 3.0 (Children per woman)
- https://www.census2011.co.in/census/state/bihar.html

Uttar Pradesh — 23.4 Cr / 234.7 Million People (2021)
- 16% have health insurance
- 44% have 10 or more years of Schooling
- The infant Mortality Rate is 50.4 per 1,000 live births
- Total Fertility Rate 2.4 (Children per woman)
- https://www.census2011.co.in/census/state/uttar+pradesh.html
Niti Aayog — 2021: Industry and Zero Hunger
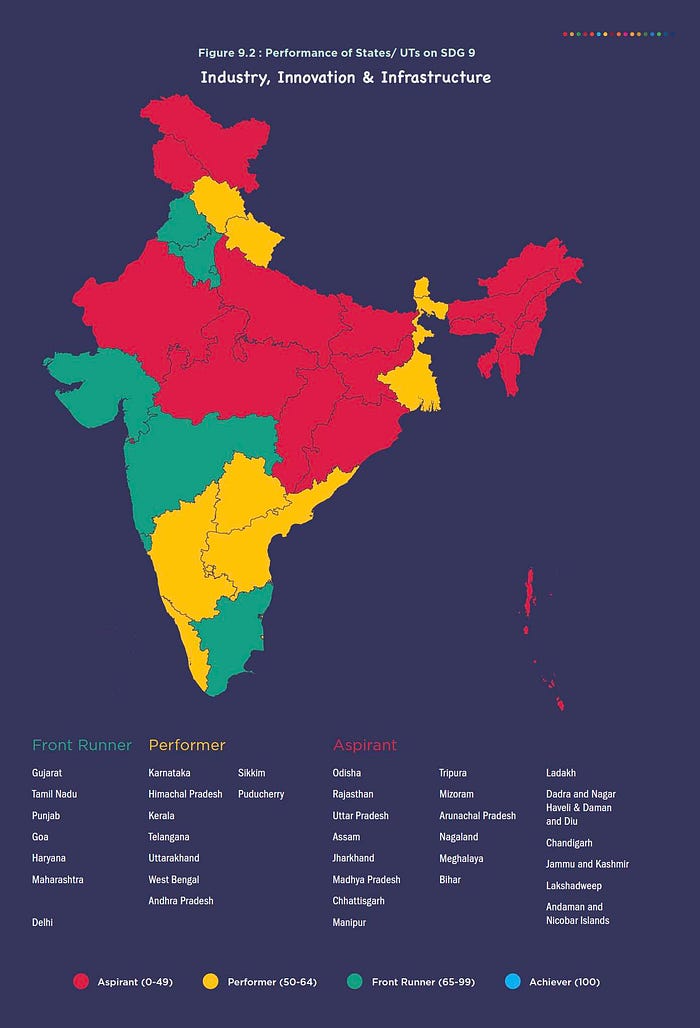
Top States In Industry, Innovation & Infrastructure
Gujarat, Tamil Nadu, Punjab, Goa, Haryana, & Maharastra are the Front Runner (Top) States. You expect the Wealthiest industrialized states will have the least Zero Hunger. You will be surprised in the next section on Zero Hunger.
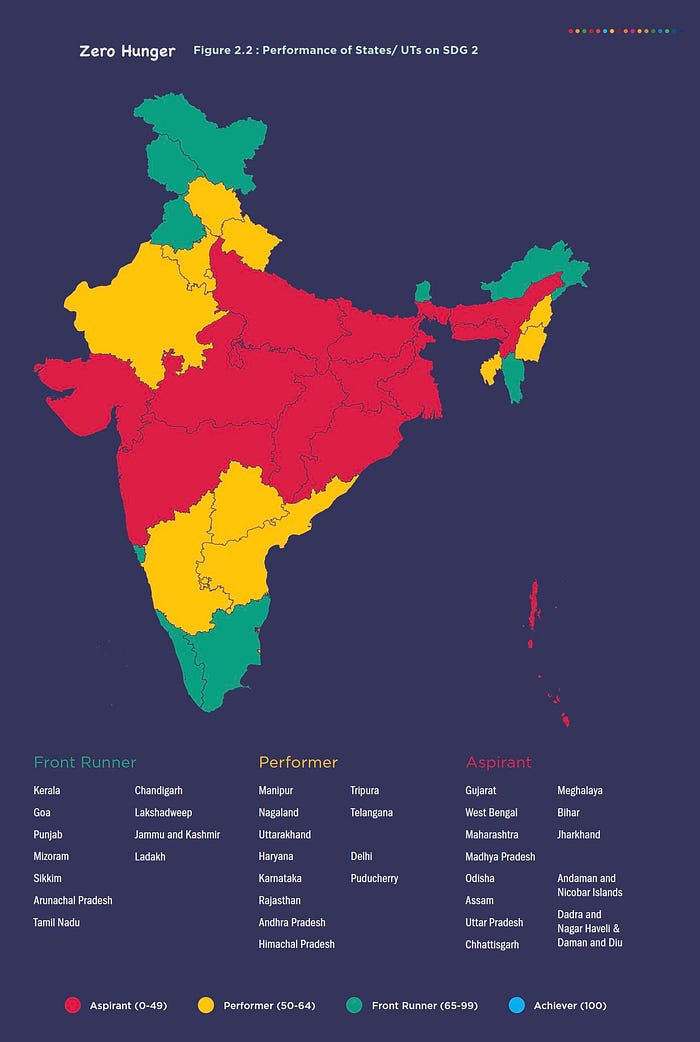
Top States in Achieving Zero Hunger
The wealthiest Industrialized state is the worst in Zero Hunger SDG Category! This shows that the Southern states followed a Pro People based Economy instead of Pro Capital. That’s why Southern states (Kerala & Tamil Nadu) rank higher on the Human Development Index.
Conclusion: Reality

In the overall ranking of the Southern states, Kerala, Tamil Nadu, Andhra Pradesh, and Karnataka rank #1, #2, and #3, while Telangana ranks #6.
The following data (Map of India) from Niti Aayog shows that Kerala, Tamil Nadu, Himachal Pradesh & Uttarakhand (in Green) are the leading States in Education.
The Government of India has recommended that states spend at least 6% of their Gross State Domestic Product (GSDP) on Education. This guideline was first established by the Kothari Commission in 1966 and was reaffirmed by the National Education Policy (NEP) 2020. As per National Health Policy (NHP) 2017, 2.5% of GSDP must be spent on Healthcare.
The other states must focus on spending at least 6% of GSDP on Education and 2.5% of GSDP on Healthcare. Moving the workforce (213 Million / 21.3 Cr people) from Agriculture to Industry will only be possible with good education and Healthcare.
Most states (other than the Southern States) spend less on Education and Healthcare as a percentage of GSDP (as per the National Policies NEP/NHP).
Turning around a society with better Education and skill set required for modern Industrial and Service based and Knowledge-based societies takes a decade or two. Education and Healthcare are State Subjects. So, it’s a long-term investment the State Government needs to focus on.
India’s Population demographics
- 0–15 years: 25.8% — 361 Million or 36.1 Cr People
- 15–49 years: 52.2% — 730.8 Million or 73.08 Cr People
- 50 and above: 22.0% — 308 Million or 30.8 Cr People
As per the NFHS-5 2019–20, India Key Indicators, 50% of the Population (age 15–49) have less than 10 years of Schooling,
i.e., 365 Million or 36.5 Cr people.
Building just infrastructure will not solve the critical problems of Society. Along with infrastructure, there should be a more significant emphasis on
- Education with adequate Skillset
- Women Empowerment
- Healthcare
In the last 350 years of world history, a country has yet to become a developed country without focusing on the above three critical elements.
Kerala and Tamil Nadu have been at the Top for the last 2–3 decades because both states followed a Human Oriented Economy.
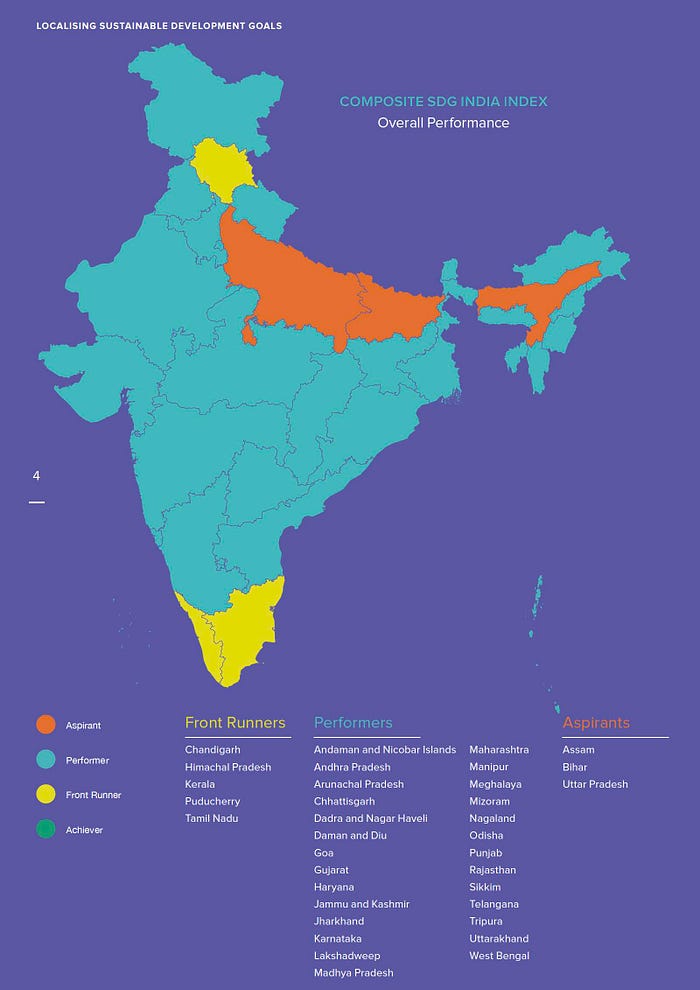
In the last two maps of India (Education — Performance of States SDG 4, Composite SDG India Index — Overall Performance), you can see Kerala and Tamil Nadu stands out. It’s time other states learn the best practices from Kerala and Tamil Nadu and adapt that to their environment. The key is to put more money (% of GSDP) into Education and Healthcare.
Watch the (next section — Reverberation) interview of
- Ashoka Mody (Former IMF and World Bank Economist. Visiting Professor at Princeton University)
- Palanivel Thiaga Rajan, Finance Minister of Tamil Nadu. He discusses various topics regarding Education, Healthcare and GST, and Federalism.
- Radhicka Kapoor — Senior Visiting Fellow (ICRIER) Indian Council for Research on International Economic Relations. She discusses Unemployment.
- Dr. Rathan Roy — Former Economic Advisor to PM Modi, discussing the unemployment crisis.
Watch the videos at your convenience (go through the video summary if you don't have time). However, read “Realization,” the 3rd and the last section of this article which sums up all the points from Reality and Reverberation.
2. Reverberation — Interviews from Politicians, Bureaucrats, Economists
India is broken — Ashoka Mody
Former IMF and World Bank Economist. Visiting Professor at Princeton University
- 7% Growth doesn’t mean much
- Primary School Education
- Secondary School Education
- Quality Teachers
- Education and Healthcare
Making Sense of India’s Unemployment Crisis
- Share of Agricultural Employment went up by 4% (in 2021)
- Need to create 20–200 million jobs
- Public Employees / Thousand Population, For India, it's 16, Brazil = 110
India Faces Mass Discontent
Why India’s Economy is Broken?
- Importance of Education, Healthcare and Women Empowerment
- Decentralization (Panchayat Raj) and How Kerala Implemented It
- Economies like the US, European Countries, China, Russia, and Japan focused on Education and Healthcare in the early stages of their Economy.
Palanivel Thiaga Rajan Talks about Freebies and the Economy
Financial Distress & Freebies
- States like Punjab and Kerala are in Financial Distress
- Freebies
- Why is the Supreme Court talking about Freebies
- State Debts (% of GSDP)
- Kerala’s Debt to GSDP ratio is 39%
- Punjab’s Debt to GSDP ratio is 51%
- India’s Debt to GDP ratio is 90%
- Germany’s Debt to GDP ratio is 70%
- UK’s Debt to GDP ratio is 99%
- France’s Debt to GDP ratio is 117%
- USA’s Debt to GDP ratio is 126%
- Japan Debt to GDP ratio is 253%
Federalism
- Concept of Federalism
- Delimitation (2026)
- Allocation of Funds between States
- GDP Growth of Southern States
- Fertility Rates in the Southern States are going down
Dravidian Model
- 03:30 Tamil Nadu Model (Dravidian Model) — Human Centric Model
- 10:00 Freebie Culture
- 32:00 Revenue Deficit
- 44:00 GST
- 47:40 Alcohol Taxes
Fuel Price, Power Shortage & Politics
- 03:03 GST
- 16:16 Case Study
- 25:05 Freebies
- 31:09 Is Welfare Politics Smart
- 41:03 Opposition Narrative
- 43:24 History of Devolution of Power
- 54:14 Impact on Tamil Nadu
Indian Economy 2023
- Economy 2023 (by NSO, India)
- Manufacturing down to 1.6%
- Mining down to 2.4%
- RBI Forecast lowered the growth to 6.8%
How the economy has failed India’s youth and women: Raghuram Rajan
- After the 1991 reforms — India grew an average of 7%
- We neglected human capital in the past (before the reforms) and are repeating that again.
- Is it possible for India to transform from Agriculture to Services?
Rising Growth, Falling Incomes
Kaushik Basu Former Chief Economic Advisor and Arvind Panagariya Former VP Niti Aayog
Kaushik Basu
- 2.5 Lakhs jobs lost from Sept 2021 till August 2022
- Youth (age: 15–29) unemployment is at 28% (41 Million / 4.1 Cr people)
- Half of the bottom half (700 Million people) is losing out on Per Capita Income
- Small Businesses and Self Employed are suffering
- India has done well in Ease of Doing Business
- Polarized Politics and hate is hurting Indian Economy
India’s Economy Slow Down — 2022–2023 (Q3 & Q4)
- 3rd Quarter GDP down to 4.4% attributed to slow down in Manufacturing sector and reduction in overall consumption.
- Private Consumption is roughly 2/3rd of the GDP (61.6%)
- The manufacturing sector contracted by 1.1% in the 3rd Quarter (2022–23)
- Government Expenditure contracted by 0.5%
- In 2022–23 GDP was 7% (6.9% revised by RBI)
GDP Grow rate decelerates to Just 4.4% in Quarter 3 (2022–23)
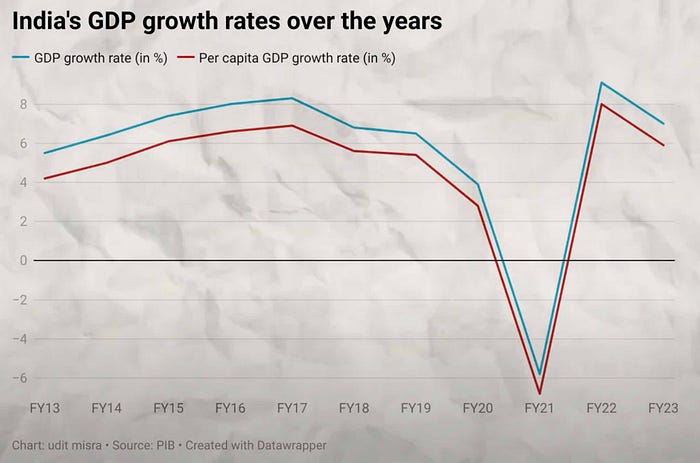
- India's Real GDP starts declining from 2016 onwards. (Data NSO — National Statistics Office)
- 2016: 8.0%
- 2017: 8.3%
- 2018: 6.8%
- 2019: 6.5%
- 2020: 3.9% (Pre-Covid)
- 2021: -5.8% (Covid)
- 2022: 9.1% (Post Covid)
- 2023: 7.0% — Last 2 Quarters of 2022–23 are touching 4.4% or less. The worry is Manufacturing (Industry) growth is declining. This entire article focuses on improving the Industry Sector and moving the Workforce from Agriculture to Industry. The revised growth rate for 2022–23 is 6.9%.
- 2024: 6.4% as Projected by the RBI Governor Shaktikanta Das. As per World Bank and IMF, the forecast is revised to 5.9%
Can India be the next China? Dr. Arvind Subramanian (Former Economic Advisor) Explains the Indian Economy and Middle class — Jan 2023
Dr. Arvind Subramanian (Former Economic Advisor to GOI, From October 2014 to June 2017) is presently a Senior Fellow at Brown University.
- Indian Economy struggled before the Pandemic, and the growth is feeble even after struggling out of the Pandemic.
- Foreign Direct Investment (FDI) stagnated at around 2% of the GDP.
- Fundamental drivers of Growth are missing.
- Apple (Foxconn) coming to India is a +ve sign. However, other companies have had bad experiences, like Walmart, Google, Ford, and Amazon.
- Rules are changed to favor some organizations, which have cautioned investors.
- The middle class is only 150 Million / 15. Cr people. That's just 10.7% of the population.
- The Indian Middle class is only a $500 billion dollar market compared to the World market (of the middle class) of $13 Trillion dollars.
- Indian Fiscal Deficit is very high and is 10% of the GDP. For every Rs. 1 as tax India gets, it's paying 20 paise for past borrowings.
- India’s MSME accounts for 30% of the GDP and 40% of the employment.
- The Informal sector got 3 shocks, Demonetization, GST, and Covid Pandemic. Any scar on the Informal sector affects the formal sector, which in turn affects the competitiveness of the formal sector in the international market.
The following video is 3 years old. However, the points Dr. Rathin Roy makes are still valid.
Unemployment Crisis — Former Economic Advisor to PM Modi. Dr. Rathan Roy
India facing youth unemployment Crisis, Says Former Economic Advisor to Modi
Dr. Rathin Roy is a former member of the Prime Minister’s Economic Advisory Council and the National Institute of Public Finance and Policy director.
- 100 Million people — not having a job, not looking for a job, and not in school (age group 15–29)
- The youth unemployment number jumped from 9 Million in 2011-12 to 25 million in 2017-18 (and 42 million by 2022)
- The probability of getting unemployed is very high if you are educated. It reflects the education system and the opportunities the youth have.
- We, collectively, as a society failing the young.
- The demographic dividend we expected as a blessing is becoming a national disaster.
- As per the NSO (National Statistical Office), overall consumption fell by 3.7% between 2012–18, and in rural India, it fell by 8.8%.
- The growth attributed is from the top 150 million of the population (you and I are included in that 150 million), and the rest of the population is not benefitting from the growth. This could be the answer to why consumption fell when there is growth.
- Around 350 million earn 3 or 4 times the minimum wage, and 200 million are below the poverty line ($2 per day).
- Consumption of the rest of the 1 Billion people needs to be increased for the economy to grow as the consumption of the top 150 million is stagnated.
Is This India’s Manufacturing Moment?
- Salil Gupte (President, Boeing India), India, has arrived in Manufacturing.
- Sanjeev Sharma (MD & CEO, ABB India) Developed a deep supply chain within the country to serve domestic and international customers. All 18 product lines are doing extremely well both on a Quantitive and Qualitative basis.
- Sunil Vachani (Chairman, Dixon Technologies), This is India’s time to become a Manufacturing Hub. The Global market for our industry ICTE (Information, Communication, Technology & Electronics) is almost $900 Billion dollars. India has about 2% market share, and our exports are about $18 billion dollars. In the next 5 years, mobile phone exports will be around $100 billion.
- Santosh Iyer (MD & CEO Mercedes Benz India) Last year (2022), Mercedes sold over 60,000 cars, each costing more than a crore rupees ($120K). Has a capacity of 20K cars production and plans to crease that to 40K cars. Got a big R&D hub in Bengaluru.
3. Realization: Consumption, Education (UDISE+)
Following is the summary of what we learned from the Reality (Niti Aayog & NFHS Reports) and Reverberations (Thoughts from the Experts across the country).
- The Agriculture Labor Force is around 213 Million 21.3 Cr people.
- Indian Middle class is just 150 Million / 15.0 Cr people, that's just 10.7% of the population.
- The youth unemployment number jumped from 9 Million in 2011–12 to 25 million in 2017–18 (and 42 million by 2022).
- As per the NSO (National Statistical Office), overall consumption fell by 3.7% between 2012–18, and in rural India, it fell by 8.8%. On Wednesday, Chief Economic Advisor V Anantha Nageswaran said the manufacturing sector's performance and growth rate in private consumption expenditure in the December quarter of 2022–23 is appearing ‘depressed’ because of a higher base.
- Consumption of the rest of the 1 Billion people needs to be increased for the economy to grow as the consumption of the top 150 million is stagnated.
- To increase consumption, we need to increase the middle class to 300–500 million or even up to 700 million. To do that, they need to have a better job, and for that, they need to be educated. When this happens, you will see a growth in GDP.
The following chart shows GDP growth projection till 2050 based on the current 7% (in 2023), 6%, 7% 8%, 9%, and 12%.

If someone is gonna tell you that India will become a $30 Trillion Economy by 2048, then they are trying to fool you. For that, we need to grow 10% from today. For such growth, you need to increase the middle class (earning potential by having a better job) from 150 Million to 500 Million (50 Cr) people or more. Many business channels say that we will touch or double the GDP (From $3.5 Trillion to $7 trillion) by the end of this decade. For that to happen, we need to grow by 10% year after year, and yet it will touch only $6.76 Trillion dollars. We are now struggling with 7% GDP (in 2023), as private consumption growth is declining (NSO Data overall consumption fell by 3.7%), and as per RBI, the GDP projection for 2024 is around 6.4% while World Bank and IMF revised the forecast to 5.9%.
All these data and interviews from the best in the country don't give a positive vibe. Having said that, it is not that we are heading toward doom. India is indeed broken, but we can fix it, provided we accept what’s broken. If we don't accept it, it’s not fixable then.
Now let’s see some positive sides of the story. Why does Morgan Stanley feel it's going to be India’s decade? Watch the video below.
This is going to be India’s decade — Morgan Stanley
The above video primarily talks about India’s Digitial initiative, all rooted in the Aadhaar initiative. India’s UPI is a world-class infrastructure for digital payments.
Why this is India’s Decade — Keynote speech by Ridham Desai (Markets and Economy — March 2023)
Ridham Desai (Managing Director — Morgan Stanley, India) Keynote summary
- India is the only country that jumped from Agriculture to Service, ignoring Industry.
- Atmanirbhar is the key to the manufacturing sector. (There are counter viewpoints to this perspective — saying Atmanirbhar is actually killing the Industry).
- UPI is free — Latest news from the Govt says UPI will be chargeable beyond Rs. 2000/-
- ONDC — Open Network Digital Commerce — will revolutionize Digital commerce.
- OCEN — Open Credit Enabled Network — will revolutionize how India Lends and borrows money.
- Per Capita Energy consumption will rise by 60% over the next 10 years.
India’s GDP will reach the $8 Trillion mark in 10 years. (This requires a 9%–10% growth from this year).
On Consumption (Private Final Consumption Expenditure — PFCE)
Private Consumption (PFCE) grew at an annual rate of 8.2% from 2004–05 till 2011–12. Then between 2012–2020, Private Consumption fell by 6.8% just before the Covid tragedy, which destroyed the already weak Consumption. It affected people at the bottom of the (Income) pyramid.
- Approximately 60% of the GDP is contributed by PFCE.
- While the next 30% of GDP is by businesses investing in ramping production — Gross Fixed Capital Formation GFCF.
- Balance is by Government Final Consumption Expenditure and Exports — Imports.
When Private Consumption (PFCE) declines, it automatically affects the businesses (GFCF), which also declines.
Governments can implement various measures to increase private consumption expenditure, leading to economic growth. Some of the strategies include:
- Monetary policy: By lowering interest rates, central banks can encourage borrowing and spending by both households and businesses. This can lead to increased private consumption as individuals can access cheaper credit.
- Fiscal policy: Governments can cut taxes, especially those affecting consumers, such as income taxes or sales taxes. Lower taxes can increase disposable income, leading to higher consumption.
- Income support: Governments can provide citizens with direct cash transfers, unemployment benefits, or subsidies. These measures can help increase disposable income, resulting in higher private consumption.
- Encouraging consumer confidence: By implementing policies that lead to economic stability, low inflation, and stable employment, governments can improve consumer confidence, resulting in higher spending and consumption.
- Infrastructure investments: Governments can invest in infrastructure projects, creating jobs and stimulating demand for goods and services. This can lead to increased consumption as workers spend their incomes.
- Promoting access to credit: Governments can create policies that make it easier for individuals and businesses to access credit. By making credit more accessible, governments can encourage borrowing and spending.
- Education and training: By investing in education and training programs, governments can improve the skills and productivity of the workforce, leading to higher incomes and increased private consumption.
- Fostering innovation: Governments can invest in research and development (R&D) and provide incentives for businesses to innovate. This can lead to the creation of new products and services, which can drive consumer demand and increase consumption.
You can choose from these 8 options, which are more apt for India in the long run, especially when we have a vast population with less than 10 years of schooling.
From the current Indian context, how do we increase the PFCE?
Improving Education with adequate skillsets for the citizens to get a better job (better earning potential) will result in higher consumer expenditure.
On Education
As per the NFHS-5 (National Family Health Survey 2019–21) by the Ministry of Health and Family Welfare.
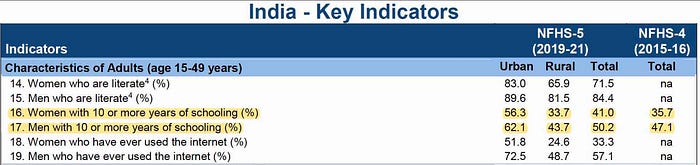
- Only 57.1% of Indians (male) have ever used the Internet.
- Only 33.3% of Indians (female) have ever used the Internet.
- Only 50.2% of Indians (male) with 10 or more years of schooling.
- Only 41.0% of Indians (female) with 10 or more years of schooling.
- 15–49 years: 52.2% — 730.8 Million or 73.08 Cr. Out of this, 50% of the population in men and 60% of women have an education less than 10 years of schooling.
- The question over here is what kind of industry you are building for them.
From 2015–16 to 2019–21, the improvement in education is barely 5% for females and 3% for males, and when you go to the Rural population, it gets worse.
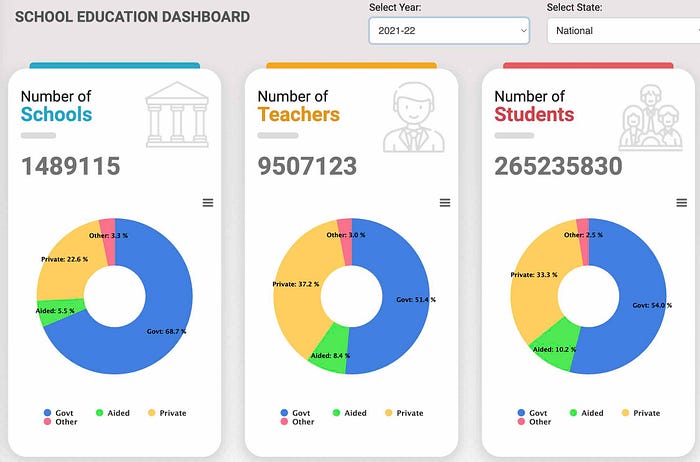
Unified District Information System for Education Plus (UDISE+)
The Indian school education system ranks among the largest globally, encompassing nearly 1.489 million (14.89 Lakhs) schools, over 9.5 million (95.07 Lakhs) teachers, and approximately 265.23 Million (26.52 Cr) students from pre-primary to higher secondary levels, coming from diverse socio-economic backgrounds. The system aims to uphold uniform standards across the country while also nurturing the nation’s rich cultural heritage.
In the early 1990s, the District Primary Education Programme (DPEP) was launched as a national endeavor, which included a school-based computerized information system. This Education Management Information System (EMIS), known as the District Information System for Education (DISE), was designed for grades 1 to 5 to facilitate the planning and monitoring of the DPEP. In 2008–09, with the introduction of the Rashtriya Madhyamik Shiksha Abhiyan (RMSA), a dedicated Secondary Education Management Information System (SEMIS) was initiated for grades 9 to 12.
Subsequently, in 2012–13, the Unified District Information System for Education (UDISE) was launched by integrating DISE and SEMIS. Under the UDISE system, schools manually input data at the school level using the paper version of the Data Capture Format (DCF), with a reference date of September 30 each year. As a result, UDISE provided school-specific data on aspects such as enrollment, physical infrastructure, and teachers.
To address the limitations of the UDISE system, the Department of School Education Literacy (DoSEL) developed the UDISE+ system with numerous distinctive features, introducing it from the reference year 2018–19. Significant improvements have been made in areas related to data capture, data mapping, and data verification.
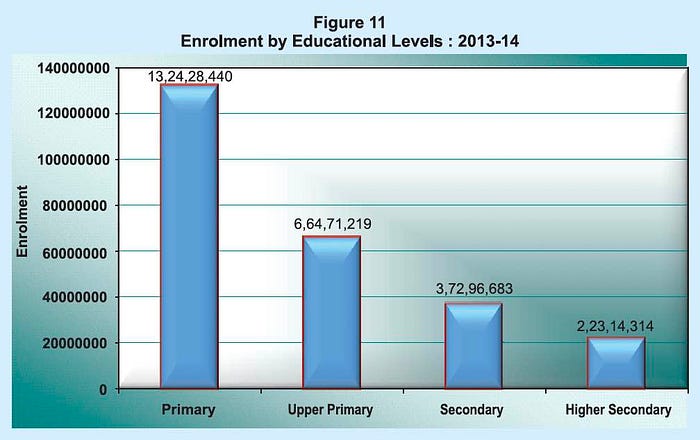
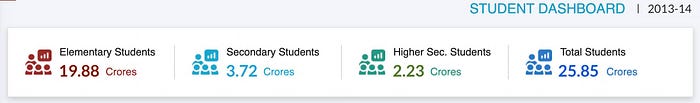
U-DISE 2013–14 Data
The following Chart shows 258.51 Million (25.85 Cr) students enrolled in Schools across India (including Govt, Govt Aided, Private, and others). 198.89 Million (19.88 Cr) Students in Elementary School, 37.29 Million (3.72 Cr) Students in Secondary Schools, and 22.31 Million (2.23 Cr) students in Higher Secondary schools.
Following is the data from UDISE+ (Unified District Information System for Education Plus)
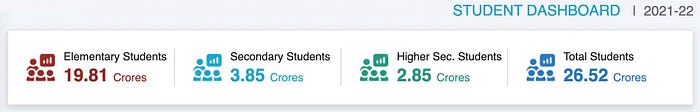
UDISE+ 2021–22 Data
The chart indicates that approximately 265.2 million (26.52 Cr) students are enrolled in schools across India, including government, aided, private, and other types of institutions.
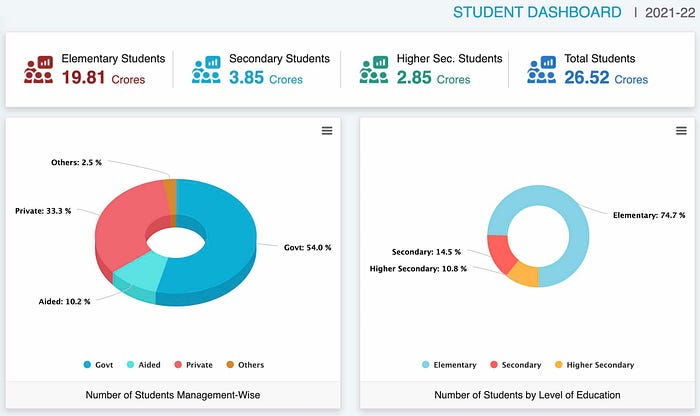
Boasting one of the world’s largest school education systems, India is home to nearly 1.489 million (14.89 Lakhs) schools, over 9.5 million (95 Lakhs) teachers, and around 26.52 crore students from diverse socio-economic backgrounds, ranging from pre-primary to higher secondary levels.
2021–22 School Data
- Elementary School (KG — Std 8th) — 198.1 Million (19.81 Cr) Students
- Secondary Students (Std 9 & 10) — 38.5 Million (3.85 Cr) Students
- Higher Sec Students (Std 11 & 12) — 28.5 Million (2.85 Cr) Students
Comparison of data from 2013 to 2022
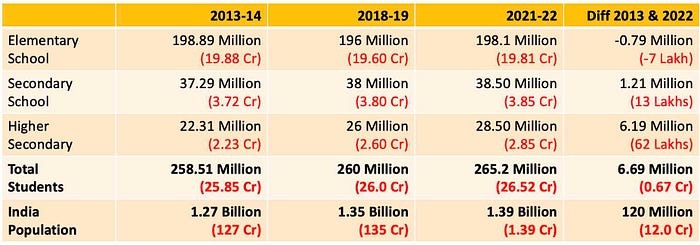
This means that barely 14.33% of students (28.5 Million / 2.85 Cr) reached Higher Secondary School out of 198.89 million / 19.89 Cr Students (from 2013–14 Elementary School).
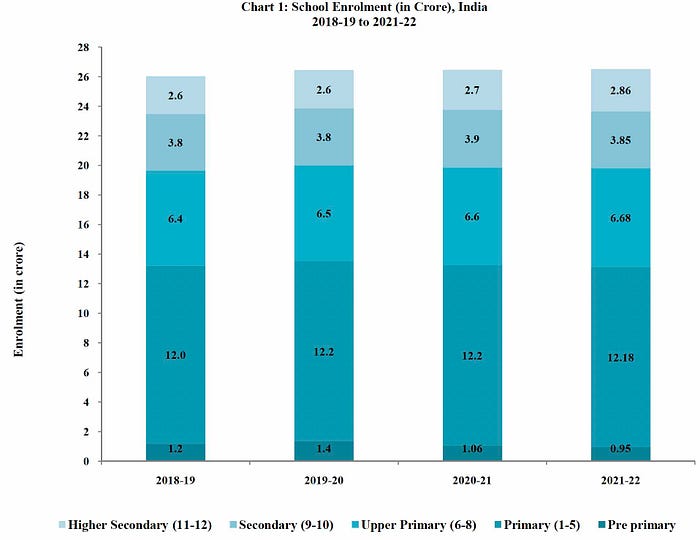
Student Enrollment from 2018 to 2022.
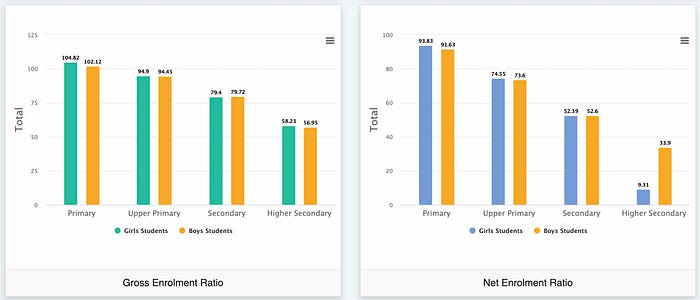
Gross Enrolment Ratio, Net Enrolment Ratio, and Aggregate Enrolment Ratio
Gross Enrolment Ratio: 2021–22
GER is the total number of students enrolled in a specific level of education (primary, secondary, or tertiary) regardless of age, expressed as a percentage of the official school-age population for that level of education. GER provides an overall picture of the level of (student) participation in the education system.
Example: If there are 1,000 students enrolled in primary education in a particular region, and the official school-age population for primary education is 900, the GER would be (1,000/900) x 100 = 111.11%. In this example, the GER is greater than 100%, indicating that there are students enrolled who are outside the official age range for primary education.

Himachal Pradesh, Kerala, Punjab, and Tamil Nadu tops this list.
Net Enrolment Ratio: 2021–22
Net Enrolment Ratio (NER): NER is the number of students within the official age group for a specific level of education (primary or secondary) who are enrolled in that level, expressed as a percentage of the total population in that age group. NER provides a more accurate indication of education access for the target age group.
Example: If there are 900 students of the official primary school age enrolled in primary education in a particular region, and the total population of the official primary school age is 1,000, the NER would be (900/1,000) x 100 = 90%. This percentage represents the proportion of the official age group that is enrolled in primary education.
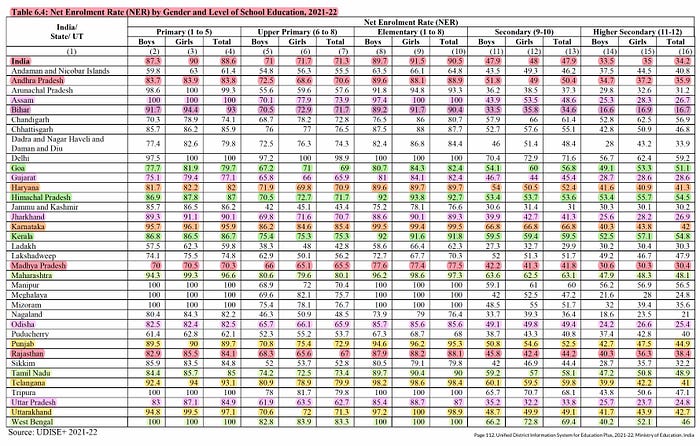
Kerala, Himachal Pradesh & Goa Tops the list
Aggregate Net Enrolment Ratio: 2021–22
Adjusted Net Enrolment Ratio (ANER): ANER is similar to NER but considers the children who are enrolled in a level of education above or below the official age group. ANER provides a more comprehensive view of education access by considering the over-aged and under-aged children in the system.
Example: Suppose there are 900 students of the official primary school age enrolled in primary education, and 50 students are of the official primary school age but enrolled in secondary education in a particular region. If the total population of the official primary school age is 1,000, the ANER would be [(900 + 50)/1,000] x 100 = 95%. This percentage reflects the proportion of children in the official primary school age group who are enrolled in either primary or secondary education.
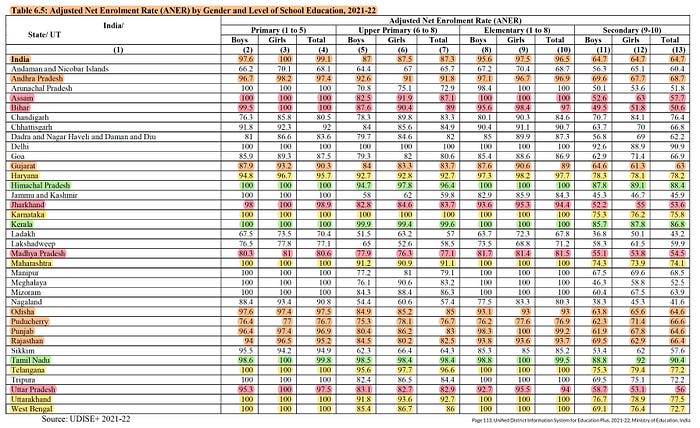
Tamil Nadu, Himachal Pradesh, and Kerala Top the list
Retention Rate by Level of Education: 2021–22

Student Distribution across Govt/Aided/Private Schools
- 54% of Students (143.2 Million / 14.32 Cr) study in Government schools
- 10.2% of Students (27.05 Million / 2.75 Cr) study in (Govt) Aided Schools.
Now let us look at the comparison of states (on School infrastructure) from this perspective.
Schools with Internet Facility: 2021–22
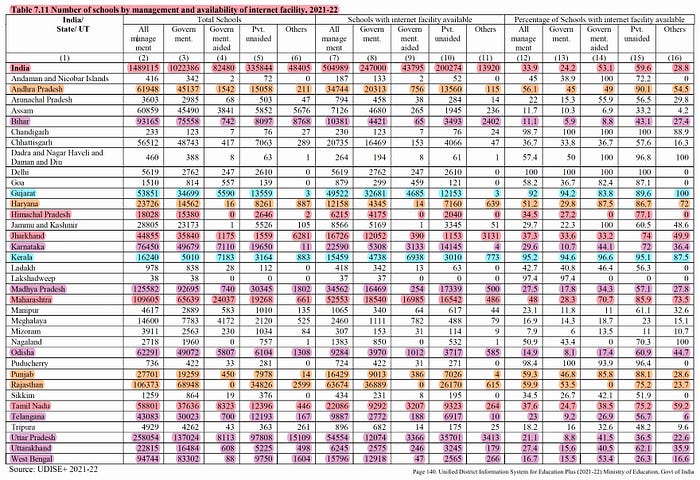
Gujarat and Kerala are away of ahead of the rest of the states for Internet facilities.
- Kerala: Govt Schools 94.6%, Aided Schools 96.6%
- Gujarat: Govt Schools 94.2%, Aided Schools 83.8%
Schools having Functional Desktop/PC: 2021–22
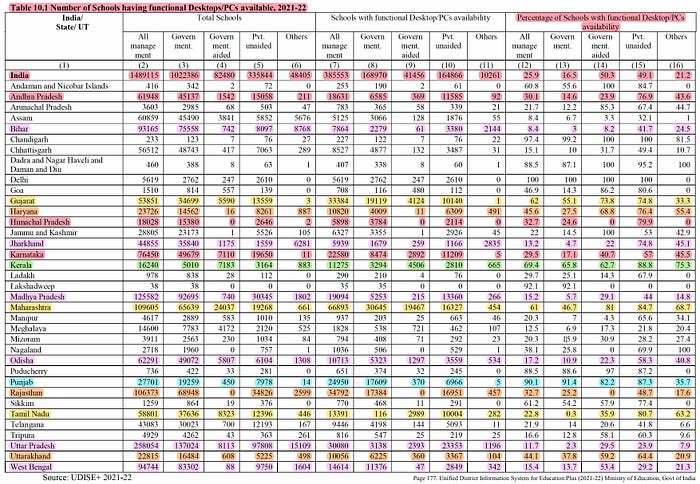
Punjab and Kerala top the list in Functional Desktop/PC available in Schools. Link this data with Internet Facility in the above chart — Schools with Internet Facility.
- Punjab: Govt Schools 91.4%, Aided Schools 82.2%
- Kerala: Govt Schools 65.8%, Aided Schools 62.7%
- Gujarat: Govt Schools 55%, Aided Schools 73.8%
Schools with Functional Laptops / Notebooks: 2021–22
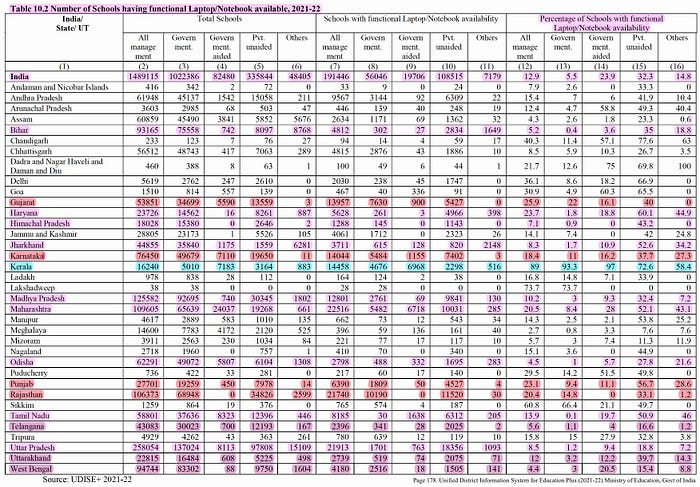
- Kerala: Govt Schools 93.3%, Aided Schools 97%
- Gujarat: Govt Schools 22%, Aided Schools 16%
Kerala is way ahead of the rest of the states in the country. Combine this data with a Functional Desktop/PC & Laptop with Internet Facility. This will give the complete picture of the use of modern technology in schools.
Schools having Functional Projectors: 2021–22
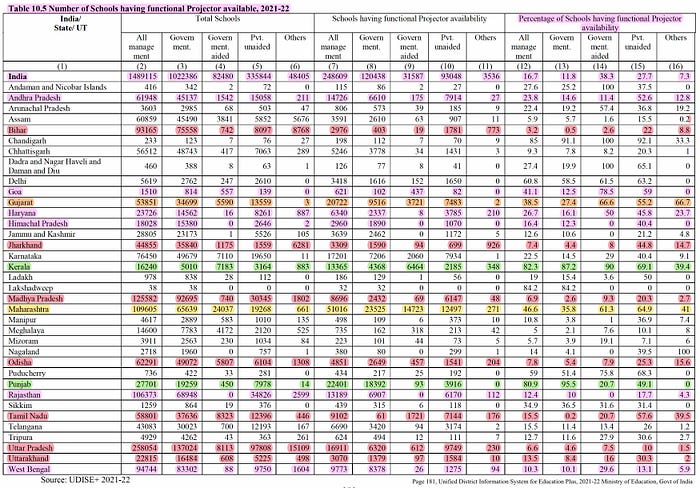
Kerala and Punjab are far ahead of the rest of the states.
- Kerala: Govt Schools 87.2%, Aided Schools 90%
- Punjab: Govt Schools 95.5%, Aided Schools 20.7%
According to the UDISE+ report, 54% of the students (143.2 Million / 14.32 Cr) study in Government Schools.
Based on the above data, except in Kerala, most of the Govt and Aided Schools need a massive infrastructure upgrade to keep up with the modern times to impart Quality Education.
“Even teachers predominantly choose private schools for their children. The majority of government schools promote rote learning, and they don’t emphasize learning outcomes,” stated Ashok Agrawal, president of the All India Parents-Teachers Association and a member of the Delhi University court.
He warned that the situation could deteriorate over the next 20 years, with the government schooling system, which provides free education and is meant to serve as a lifeline for the economically disadvantaged, potentially facing elimination.
Sameet Panda, a Right to Food Campaign activist who also advocates for RTE Act compliance in Odisha, explained that the central government’s school closure policy has resulted in many tribal children being deprived of education.
“In tribal regions, schools are few and far between. Numerous schools have been shut down, leaving children with no choice but to stay at home because the nearest school is 5 kilometers away. This constitutes a denial of the right to education and the right to a dignified life,” Panda said.
Mitra Ranjan, an activist affiliated with the RTE Forum, an NGO, argued that the government is shirking its responsibility by claiming that schools with low enrollment should be closed.
“The government should do a mapping exercise for the dropouts and the children engaged as child laborers. They must be brought back to school. Then all the government schools will be crowded,” Ranjan said.
Performance Grading Index (PGI)
The Performance Grading Index (PGI) is a fairly recent index developed to assess the performance of States and Union Territories (UTs) in the realm of school education using a standardized scale. This index aims to offer insights into the current state of educational systems in various States and UTs, shedding light on the primary factors that contribute to their performance and identifying crucial areas needing improvement. By highlighting these gaps, the PGI assists States and UTs in prioritizing intervention areas, ensuring a strong and well-rounded school education system at all levels.
The PGI is formulated using 70 distinct indicators across 2 Categories, which are further divided into 5 Domains.

The data for the 2020–21 PGI is sourced from a variety of platforms, including the Unified District Information System for Education Plus (UDISE+) for the 2020–21 period, the 2017 National Achievement Survey (NAS), the MDM Portal, and additional data supplied by MIS Coordinators from the respective States and Union Territories.
Conclusion: Realization
GDP: The Agriculture Labor Force is around 213 Million 21.3 Cr people. We need to move this workforce into Industry for us to have sustainable growth of 7% and upwards.
Manufacturing Sector: Growth Rate of Gross Value Added
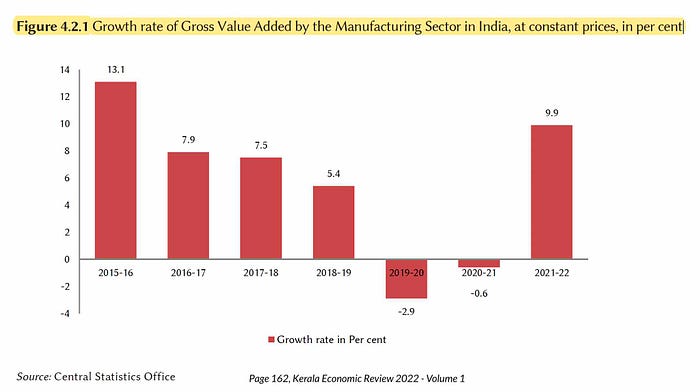
The above chart shows that Manufacturing is declining from 2015–16 onwards, which is not a good sign when you want to move the Labor force from Agriculture to Urbanized Manufacturing (Industry). Manufacturing declined in 2022–23 also (compared to 2021–22).
Indian Middle class: The middle class is only 150 Million / 15. Cr people. That’s just 10.7% of the population. This needs to be increased to 300–500 Million, if not 700 million.
Private Final Consumption Expenditure (PFCE): In 2019, the National Statistical Office (NSO) report revealed a concerning shift in India’s poverty reduction progress between 2011–12 and 2017–18. For the first time in 40 years, the real monthly per capita consumption expenditure (MPCE) experienced a decline of 3.7%, dropping to ₹1,446 in 2017–18 from ₹1,501 in 2011–12 (and in rural India, it fell by 8.8%). Simultaneously, another NSO report from the same period, the Periodic Labour Force Survey (PLFS) of 2017–18, indicated that the unemployment rate (UR) had reached a 45-year high at 6.1%. Furthermore, during this period, India experienced a loss of 9 million jobs, marking an unprecedented occurrence in the nation’s history.
The Central government will provide free foodgrains to about 81.35 crore beneficiaries under the National Food Security Act (NFSA) for one year from January 1, 2023. That’s for 58% of the population who is fed for a year. The key question over here is:
- Why or How did we reach here?
- How do we ensure that this is avoided in the future?
- How do we elevate 813.50 Million (81.35 Cr) people from this state?
Consumption Expenditure is 60% of our GDP. To increase the Consumption Expenditure, we need to ensure that they (the Indian Middle class) get better jobs, resulting in better income. The only way this can be achieved is through better Education.
India’s Population demographics
- 0–15 years: 25.8% — 361 Million or 36.1 Cr
- 15–49 years: 52.2% — 730.8 Million or 73.08 Cr
- 50 and above: 22.0% — 308 Million or 30.8 Cr
Education: As per the NFHS-5 2019–20, India Key Indicators, 50% of the Population (age 15–49) have less than 10 years of Schooling,
i.e., 365 Million or 36.5 Cr people (less than 10 years of schooling)
The following chart shows that barely 14.33% of students (28.5 Million / 2.85 Cr) reached Higher Secondary School out of 198.89 million / 19.88 Cr Students (from 2013–14 Elementary School).
We need to ensure that out of 19.81 Cr students (in the Elementary Schools in 2021–22), at least 70%-80% of the students will reach Higher Secondary instead of the current 2.85 Cr (which is 14.33%). For this, we need to ensure better school infrastructure and job opportunities in rural areas so that parents ensure that their kids are in school instead of dropping out of school and going as unskilled labor in the schooling age. We need to spend more money on Technical Education / Vocational Training. Currently, only 4.80% of the budget is allocated for Technical Education. Check out the following session on Education Budget for more details.
Education Budget as a Percentage of GDP
The data reveals that the total expenditure on education as a percentage of GDP has begun to demonstrate a rising trend, increasing from 3.84% in the 2013–14 fiscal year to 4.64% in the 2020–21 fiscal year.
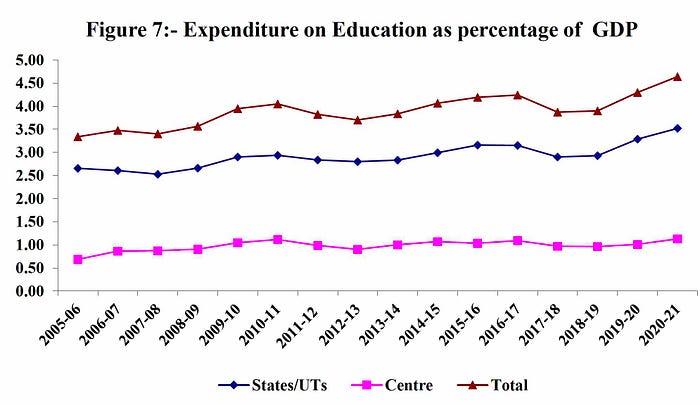
Examining the percentage share of GDP for the Centre and States individually, it is evident that the Centre’s share has been on an upward trajectory over time. It has increased from 0.51% in 2000–01 to 1.11% in 2010–11, and after a minor decline in the following two years, it reached 1.13% in 2020–21. On the other hand, the States’ share has experienced a decrease, dropping from 3.63% in 2000–01 to 3.52% in 2020–21.
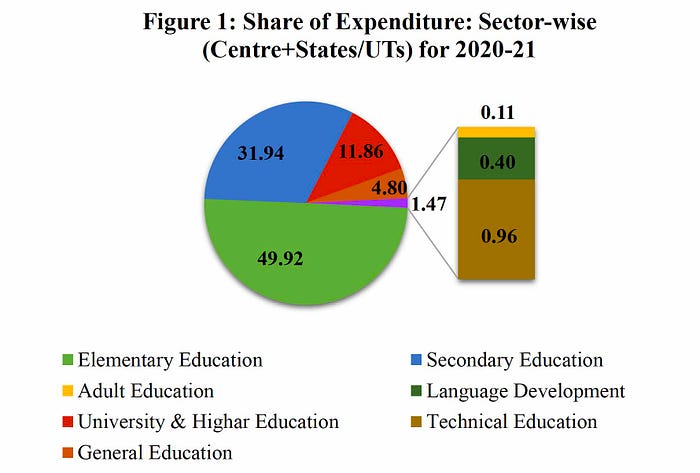
The following pie chart shows how the Education Budget of Rs. 6.25 Lakh Cr. is spent. For University & Higher Education (11.86%) and Technical Education (4.80%) combined is approximately 17%.
Is this good enough when we want to move a lot of the workforce from Agriculture to Industry?
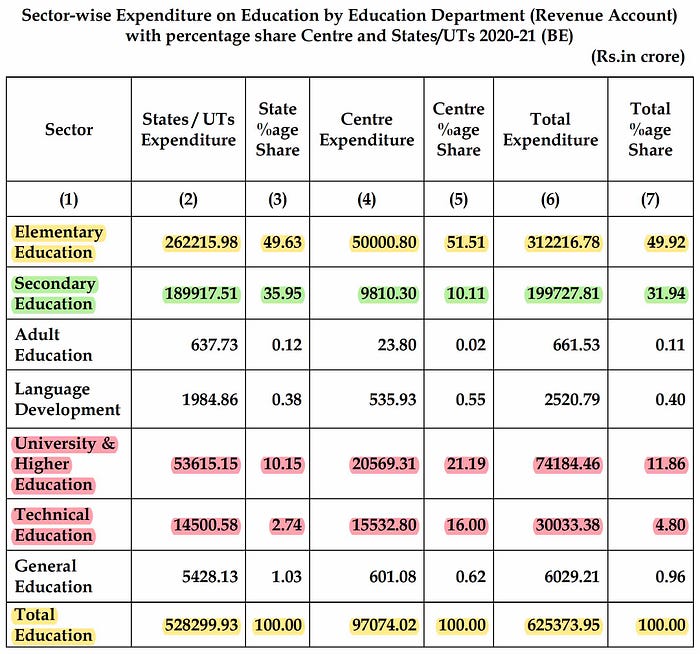
So, it’s very clear that we need to put more money into Education compared to the 4.64% of GDP (2021), as we have a lot of work to do in the next few years.
Higher Education — AISHE 2020–21: Gross Enrollment Ratio Report
- Tamil Nadu — 46.9%
- Uttarakhand — 45.7%
- Kerala — 43.2%
- Telangana —39.1%
- Himachal Pradesh — 38.7%
- Andra Pradesh — 37.2%
- Karnataka — 36.0%
- Maharashtra — 34.9%
- Madhya Pradesh — 27.1%
- Uttar Pradesh — 23.2%
- Gujarat — 22.2%
- Jharkhand — 17.0%
- Bihar — 15.9%
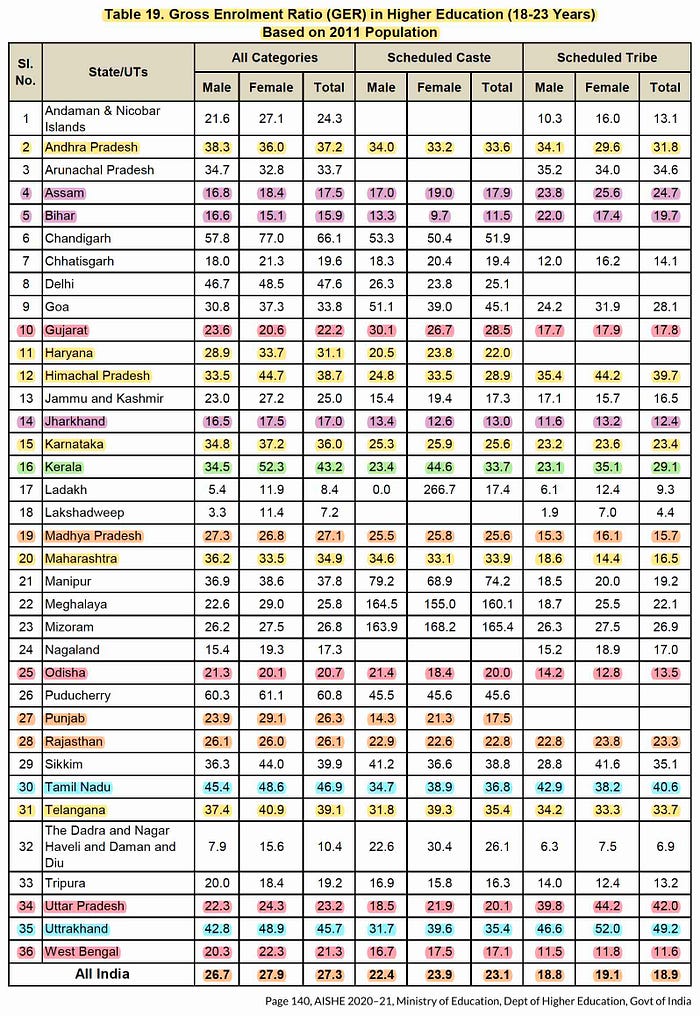
The Gross Enrollment Ratio (GER) in Kerala in 1972–73 was around 5.9%, and in 1986–87, it was merely 4.5%. From there on, Kerala improved a lot, and in 2006–07, the ratio grew up to 11.8%. After 2009–10 Kerala’s GER began to rise rapidly till it reached 43.2% in 2020–21.
Higher Education Expenses By Kerala from 2017–22

Youth Unemployment is on the rise.
- Share of Agricultural Employment went up by 4% (in 2021). Ideally, this number should be declining if we move the workforce from Agriculture to Industry.

Source: https://unemploymentinindia.cmie.com/
The unemployment rate of Haryana was 37.4% percent in the month of December 2022, followed by Rajasthan at 28.5%, Delhi at 20.8%, Bihar at 19.1%, and Jharkhand at 18%. As per the CMIE data, 41.7 million / 4.1 Cr. youth are unemployed.
Healthcare: Infant and Child Mortality rates are key parameters to measure the health of a state or a country. As per WHO (World Health Organization), Infant mortality represents an essential component of under-five mortality. Like under-five mortality, infant mortality rates measure child survival. They also reflect the social, economic, and environmental conditions in which children (and others in Society) live, including their health care.
The following table shows data from Indian States, India, and other developed countries.
No one is debating over our technological progress, like Mission to Mars, Aadhaar, E-KYC, UPI, etc., or the high-quality highways we built in the last decade or two.
However, our focus is on the human side of the story. Human Development is critical for India’s progress. There is a vast population of Indians without proper education and the proper skillsets, which are critical requirements to get a better job. That's the problem we want to address.
The solution to this problem is to focus on the 3 points below for the next 5–10 years.
- Education with adequate Skillset
- Women Empowerment
- Healthcare
When we do this, what we are building is a society with a very high earning potential (which automatically results in higher expenditures — Private Consumption)
Southern states are already way ahead in the above 3 categories that’s because the state Governments spend a considerable amount of time and money in bringing up their citizens with quality education and healthcare.
Decentralization and the Developed Nations
Another critical thing to implement the above successfully is Decentralization (Panchayat Raj) which Kerala implemented successfully.
Decentralization involves the transfer of power and decision-making authority from central to regional, local, or community levels. It can manifest in various forms, such as political, administrative, fiscal, and market decentralization. Here’s a brief overview of how decentralization has been implemented in Developed Countries and Developing regions:
- United States: The U.S. has a federal system where power is divided between the central government and the states. Each state has its own constitution, government, and laws, allowing for significant decentralization in areas like education, healthcare, and taxation. Local governments also play a crucial role in policy implementation and service delivery at the municipal and county levels. Reference: Zimmerman, J. F. (2001). The U.S. federal system: Decentralized political institutions. In National League of Cities (Ed.), Decentralization and Federalism in the United States (pp. 13–34). Center for the Study of Federalism.
- France: Historically, France has had a centralized system, but in recent decades, it has undertaken a series of decentralization reforms. These reforms have transferred authority to regional, departmental, and municipal levels, mainly in areas like education, health, and transportation. Local governments are responsible for their budgets, investments, and development policies. Reference: Cole, A. (2006). Decentralization in France: Central steering, capacity building, and identity construction. French Politics, 4(1), 31–57.
- China: China is a unitary state with a centralized political system. However, it has implemented a form of administrative decentralization, with provinces, autonomous regions, and municipalities having some degree of power. Additionally, China has implemented fiscal decentralization, allowing local governments to raise and allocate resources independently. This decentralization is more evident in areas like economic development and infrastructure projects, but the central government retains significant control over political and social matters. Reference: Xu, C. (2011). The fundamental institutions of China’s reforms and development. Journal of Economic Literature, 49(4), 1076–1151.
- Germany: Germany is a federal state with a high degree of decentralization. It has 16 federal states (Länder) with their own constitutions, governments, and parliaments. They have significant autonomy in areas like education, healthcare, law enforcement, and infrastructure. This system ensures that local needs are addressed more effectively. Reference: Jeffery, C. (2005). Germany’s federal system in comparative perspective. German Politics, 14(3), 275–290.
- United Kingdom: The UK has undergone a process of devolution, transferring power from the central government to regional administrations in Scotland, Wales, and Northern Ireland. These devolved governments have control over areas like education, health, transportation, and the environment. However, England remains more centralized, with local governments having limited powers. Reference: Trench, A. (2004). Has Devolution Made a Difference? The State of the Nations 2004. Imprint Academic.
- Kerala (India): India has a federal system, but power is concentrated at the national and state levels. However, the state of Kerala has been a pioneer in implementing decentralization policies. Kerala has undertaken significant administrative and fiscal decentralization reforms, empowering local governments (Panchayats) with decision-making authority over resources, planning, and development projects in areas like education, health, and infrastructure. Reference: Isaac, T. M., & Franke, R. W. (2002). Local democracy and development: The Kerala people’s campaign for decentralized planning. Rowman & Littlefield.
- Rest of India: Decentralization in India varies across states. The 73rd and 74th Constitutional Amendments in 1992 sought to strengthen local governance, creating three-tier Panchayats (rural) and Municipalities (urban). However, the extent of decentralization varies, with some states providing more autonomy and resources to local governments than others. Progress has been uneven, and challenges such as bureaucratic resistance, inadequate financial resources, and capacity constraints persist. Reference: Mathur, N. (2013). From government to governance: A brief survey of the Indian experience. National Book Trust, India.
In summary, decentralization is implemented differently across these countries and regions, reflecting historical, cultural, and political contexts. The level of decentralization varies, but the overall goal is to promote more responsive and accountable governance by bringing decision-making closer to the people.
Implementation of Panchayat Raj in Kerala
Panchayat Raj is a system of local self-governance in India, introduced in the 1950s. It aims to decentralize power and decision-making to the grassroots level and involves the establishment of elected local bodies at the village, block, and district levels.
In Kerala, the Panchayat Raj system was implemented in 1994 through the Kerala Panchayat Raj Act. Implementing the system in Kerala has been widely lauded as a success, with several vital impacts.
One of the most significant impacts of the Panchayat Raj system in Kerala has been empowering local communities, particularly women and marginalized groups. The system has provided a platform for these groups to participate in decision-making processes and to have a more significant say in local governance.
Another impact of the Panchayat Raj system in Kerala has been the improvement in the delivery of essential services such as healthcare, education, and sanitation. The system has enabled greater accountability and transparency in the use of public funds and resources.
In terms of implementation, the Panchayat Raj system in Kerala differs from the rest of the country in several ways. For instance, the system in Kerala provides for the direct election of representatives at the village level, whereas in other states, these representatives are often appointed by higher-level officials.
The Panchayat Raj system in Kerala also provides greater financial autonomy for local bodies, with more resources allocated for local development projects.
The following 3 critical milestones in Kerala’s history transformed Kerala society.
- Land Reforms Act in 1957 by Kerala CM E.M.S Nampoothiripad. The Land Reforms Act was a historic legislation that aimed to abolish the feudal system of land ownership and distribute land to landless peasants and farmers. The Act imposed a ceiling on landholdings and prohibited the eviction of tenants.
- Education Bill in 1976 by Kerala CM C. Achutha Menon. The Bill sought to eliminate disparities in education by introducing free and compulsory education up to the age of 14 years and setting up schools in every village.
- Panchayat Raj Act in 1994 by Kerala CM E.K. Nayanar. It aims to decentralize power and decision-making to the grassroots level and involves the establishment of elected local bodies at the village, block, and district levels.
So, before I end the 3rd & final section, let me reiterate the 3 points again (3rd time) and the Government must focus on these critical action items for the next 5–10 years.
- Education with adequate Skillset
- Women Empowerment
- Healthcare
It’s time we stop dividing the country in the name of caste, religion, color, food habits, dress, region, etc. It’s time for civil society to speak up for the country's well-being.
Let me conclude with the statement by Abraham Lincoln in his Gettysburg Address in 1863.
Government
- Of the people — The government is elected by the people and is accountable to them.
- By the people — In a democracy, people have the right to express their views, participate in the decision-making process, and hold their leaders accountable.
- For the people — The government should work towards improving society by providing basic amenities, social welfare, and economic development. The government should ensure that the people's basic needs, such as food, shelter, and healthcare, are met.
Epilogue: Southern Style — Dravidian Model
India Today: State of States — Dec 17, 2022
Top 5 Big States
- Tamil Nadu
- Himachal Pradesh
- Kerala
- Gujarat
- Punjab
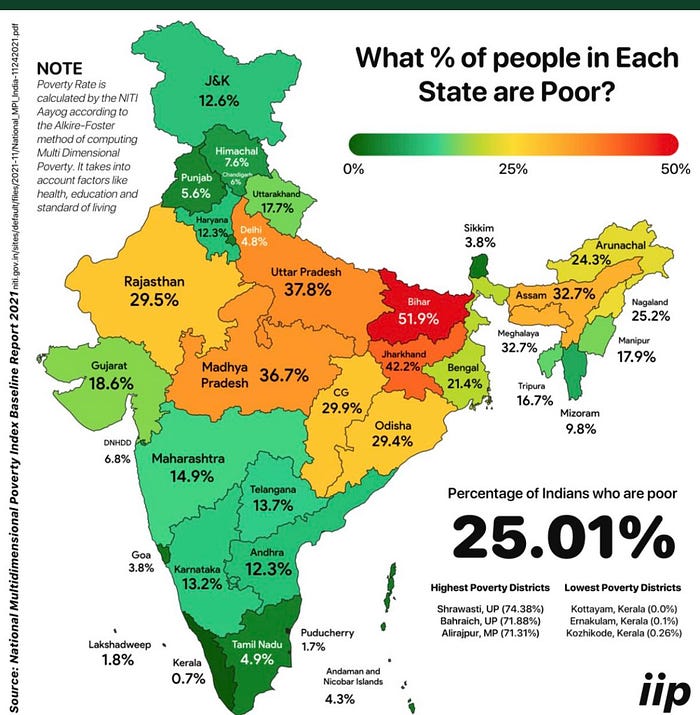
The poverty rate in Kerala is 0.7% and Tamil Nadu 4.9%, while MP 36.7%, UP 37.8%, Jharkhand 42.2%, and Bihar 51.9% show a difference as vast as Europe and Africa. It’s time we focus on devolution. #Federalism
Awake, Arise, Stop not, till the goal is reached!
Swami Vivekananda
My blogs on the Indian Economy
- 2005 — India in the year 2020
- 2013 — India’s Socio-Economic Progress (From 1900–2012)
- 2023 — India 2050 — What do we need to do? (This article)
- 2024 — State of Indian States
- 2024 — Indian Budget 2024
- 2024 — The Economic Rise of Southern States.
- 2024 — Advancing Education & Colleges in India: Key Priorities
My Blog on Education System
Niti Aayog Reports
They were initially published at https://arafkarsh.com.